
Optimize your assets, trading, and ancillary services.
Independent power producers lose margin when forecasts are generic, underperformance goes unattributed, and settlement runs on spreadsheets. Ona closes the gap between physical generation and financial outcomes — with site-tuned intelligence you can use in the dashboard or embed via SDK.
The Business Problem
Trading, wheeling, and ancillary service decisions depend on numbers your current stack can't produce reliably — or produces too late to act on.
Generic forecasts miss site reality
Industry models need 24+ months of local data for bankable projections. Without site-tuned forecasts grounded in your telemetry, trading bids and PPA settlements are built on assumptions — not your asset.
Underperformance hides in portfolio averages
When 4 of 7 inverters underperform but portfolio KPIs look acceptable, cumulative revenue loss goes unnoticed. You need per-inverter attribution with financial impact — not threshold alarms.
Settlement and dispatch need deterministic execution
Cloud lag costs money in trading intervals. Wheeling certificates, municipal reconciliation, and dispatch optimization require sub-fifteen-minute pipelines — with identical inputs producing identical control decisions every time.
Ona: Bounded Intelligence for Asset Optimization
A JEPA + LLM hybrid architecture — System 1 runs continuously on every inverter; System 2 triggers only when severity earns the compute. Both ship as composable SDK modules.
JEPA World Model — Predictive AI
Continuous physics-conditioned tracking on 5-minute telemetry. Site-tuned generation forecasts, per-inverter performance ratios, and financial impact quantification — the numbers that feed trading bids, wheeling settlement, and ancillary service dispatch.
Transfer learning from regional baseline datasets bypasses the standard two-year data-accumulation requirement. Bankable projections in weeks, not years.
Nehanda Reasoner — Retrieval-Grounded Synthesis
When JEPA flags severity, Nehanda produces cited diagnostics: OEM troubleshooting steps, tariff context, and regulatory interpretation — bounded to retrieved evidence, not free-text chat. The anomaly writes its own query; Nehanda synthesizes over manufacturer manuals and policy corpora.
Deterministic Decision Layer
Dispatch optimization, trading interval bids, and wheeling certificate generation run on deterministic solvers — identical inputs yield identical outputs. Generative models occupy Orient only; they never hold closed-loop actuation authority over physical assets.
From day-ahead bidding to automated wheeling reconciliation
Unpredictable solar yield leads to costly market imbalance fines and disputed off-taker invoices. Ona connects physical generation directly to financial accounting—feeding site-tuned yield curves into 15-minute trading bids and generating audit-ready settlement certificates automatically.
- Imbalance Penalty Avoidance: High-precision 15-minute intraday yield forecasts protect margins during sudden cloud-cover ramps.
- Automated Wheeling Certificates: Instant reconciliation of multi-party wheeling credits across municipal and utility grid nodes.
- Financial Variance Visibility: Track expected vs. realized revenue in real time with automatic PPA tariff indexing.
Real-World Revenue Recovery
See how Ona turns operational data into quantified financial value across forecasting, data reconstruction, anomaly detection, and edge deployment.
Gold Mine Power Production Forecasting
Reliable Yield Forecasting in 1 Week with Only 3 Months of Data — Enabling Bankable Revenue Projections
Challenge
Only 3 months of historical data available for a 2 MW solar plant. Industry standard requires 24+ months for accurate forecasting models, making bankable revenue projections impossible with limited local data.
Lost Data Imputation
Overcoming 65% Data Loss: Preserving Revenue Reporting Through Infrastructure Failure
Challenge
Severe data loss — 65% missing data points across a multi-MW portfolio. Sensor and telemetry failures made traditional monitoring and revenue reporting impossible.
Embedded Generation Revenue Recovery
Quantifying Hidden Revenue Loss: Per-Inverter Attribution Turns Underperformance Into Recoverable Dollars
Challenge
System Performance Ratio at 74.1% vs 80% contractual target. 4 of 7 inverters underperforming with an energy shortfall of 291,279 kWh (32.2%). Without per-inverter attribution, the cumulative revenue loss went unnoticed by ownership.
Access via UI and SDK
Operators use the Ona Platform dashboard. Engineers embed intelligence directly into trading systems, ERP workflows, and custom automations.
Dashboard & Tools
Forecasts, monitoring dashboards, settlement views, and Energy-at-Risk reports — no code required.
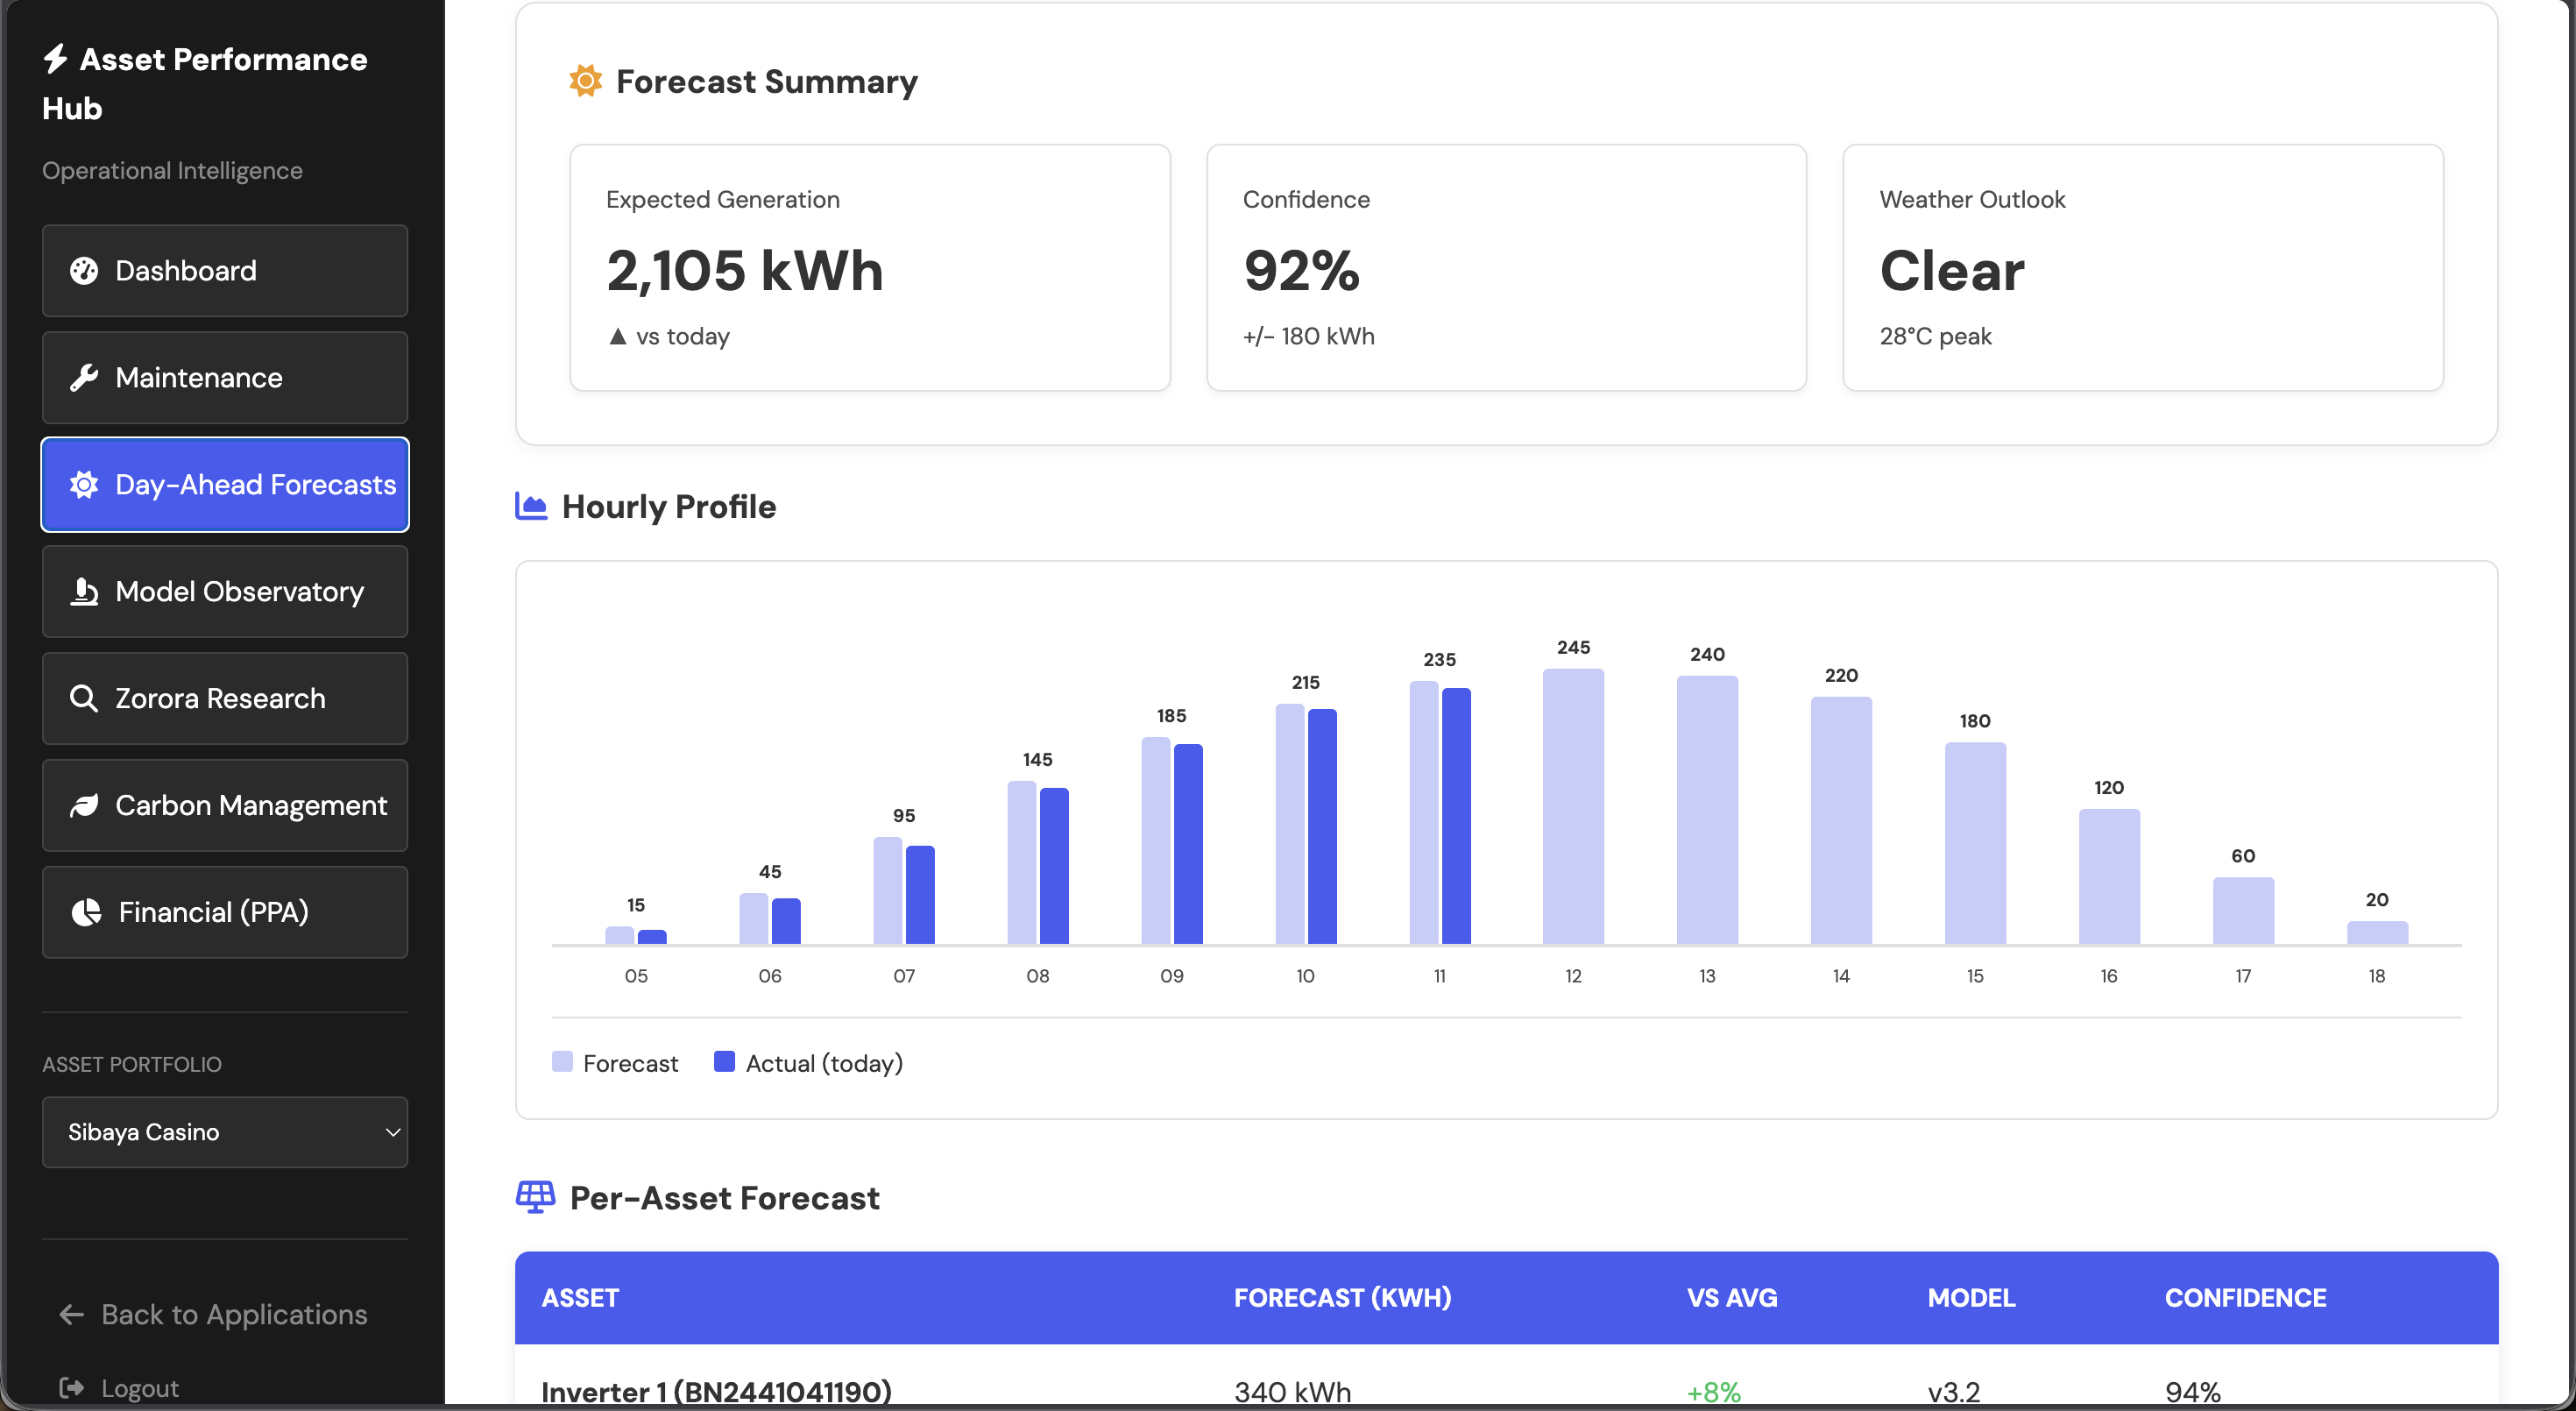
- Day-ahead forecasting via forecast.asoba.co
- Per-meter anomaly monitoring & alerts
- Portfolio performance & settlement reports
Python & JavaScript SDKs
REST APIs and SDK clients for production integrations — compose forecasts, OODA alerts, and Nehanda diagnostics into your existing stack.
Pricing
Start with per-meter anomaly monitoring. Add carbon, PPA, and trading modules as your optimization stack grows. Available via UI and SDK.
Per-Meter Anomaly Monitoring
Continuous physics-based anomaly detection across your inverter fleet. Get alerted before a hardware fault becomes a month of lost production — with automatic financial impact tracking in your local currency.
- 5-minute telemetry ingestion
- Physics-based fault detection (JEPA world model)
- Inverter state fault classification
- Email & webhook alerts
- Monthly delta performance report
- Rolling financial impact tracking
Add-On Modules
Extend monitoring with the modules your use case demands — trading, settlement, carbon, and PPA. Each add-on layers on existing telemetry with no re-integration.
- Carbon Monitoring — Scope 2 emissions, ESG & investor reporting
- PPA Management — Settlement-grade metering, offtaker billing
- Trading & Settlement — Wheeling certificates, dispatch optimization, regulatory intelligence
All monitoring and add-ons run on the Open Data Schema for Energy (CC-BY-SA / Apache 2.0). Install the standard for free. When you're ready for continuous intelligence, it scales up with zero integration cost.
Start optimizing your asset and trading decisions.
Connect via the Ona dashboard or embed intelligence through the SDK. We'll map your forecasting gaps and show you exactly what site-tuned optimization delivers.