This case study presents an Energy-at-Risk (EAR) assessment of a 2.31 MW commercial ground-mounted solar installation at Gweru Gold Mining. Using Ona — Asoba's AI-powered energy surveillance and management system — we analysed 70,928 production records and 1,968 weather observations over an 88-day monitoring period (1 November 2025 to 28 January 2026) to quantify production losses, detect anomalies, and model financial recovery scenarios.
The customer name and site location in this write-up have been anonymized at the customer's request. Every figure below — production records, anomaly counts, performance ratios, and dollar values — is reported exactly as measured on the real deployment; nothing has been rounded, adjusted, or fictionalized. Financial figures were originally measured in South African Rand and are presented here in USD at a fixed conversion rate of R16.558/$1.
The assessment identified 54,246 kWh in lost energy (7.4% below the contractual target), representing $16,708 in grid replacement costs. A total of 14,642 anomaly events were detected across 7 inverters, with the system performance ratio at 74.1% against an 80% contractual target. Per-inverter decomposition revealed that 4 of 7 units operated below target, with the worst performer at 54.9% PR. Three recovery scenarios project between $34,632 and $69,264 in annualised recoverable revenue from targeted maintenance interventions.
- 54,246 kWh in energy lost — 7.4% below contractual target over the 88-day period
- $16,708 in grid replacement costs, reconciling to a 16% utility bill discrepancy
- 14,642 anomaly events detected across 7 inverters using AI-driven anomaly classification
- $69,264 annualised projected loss if current performance gap (5.9 pp) remains uncorrected
Gweru Gold Mining Solar Installation
The subject installation is a commercial ground-mounted PV system offsetting grid consumption for a gold ore processing plant, monitored through Huawei FusionSolar inverters with 15-minute SCADA telemetry. The assessment followed a three-stage methodology: model training and validation, anomaly detection with per-inverter decomposition, and financial recovery quantification.
Establishing the Baseline
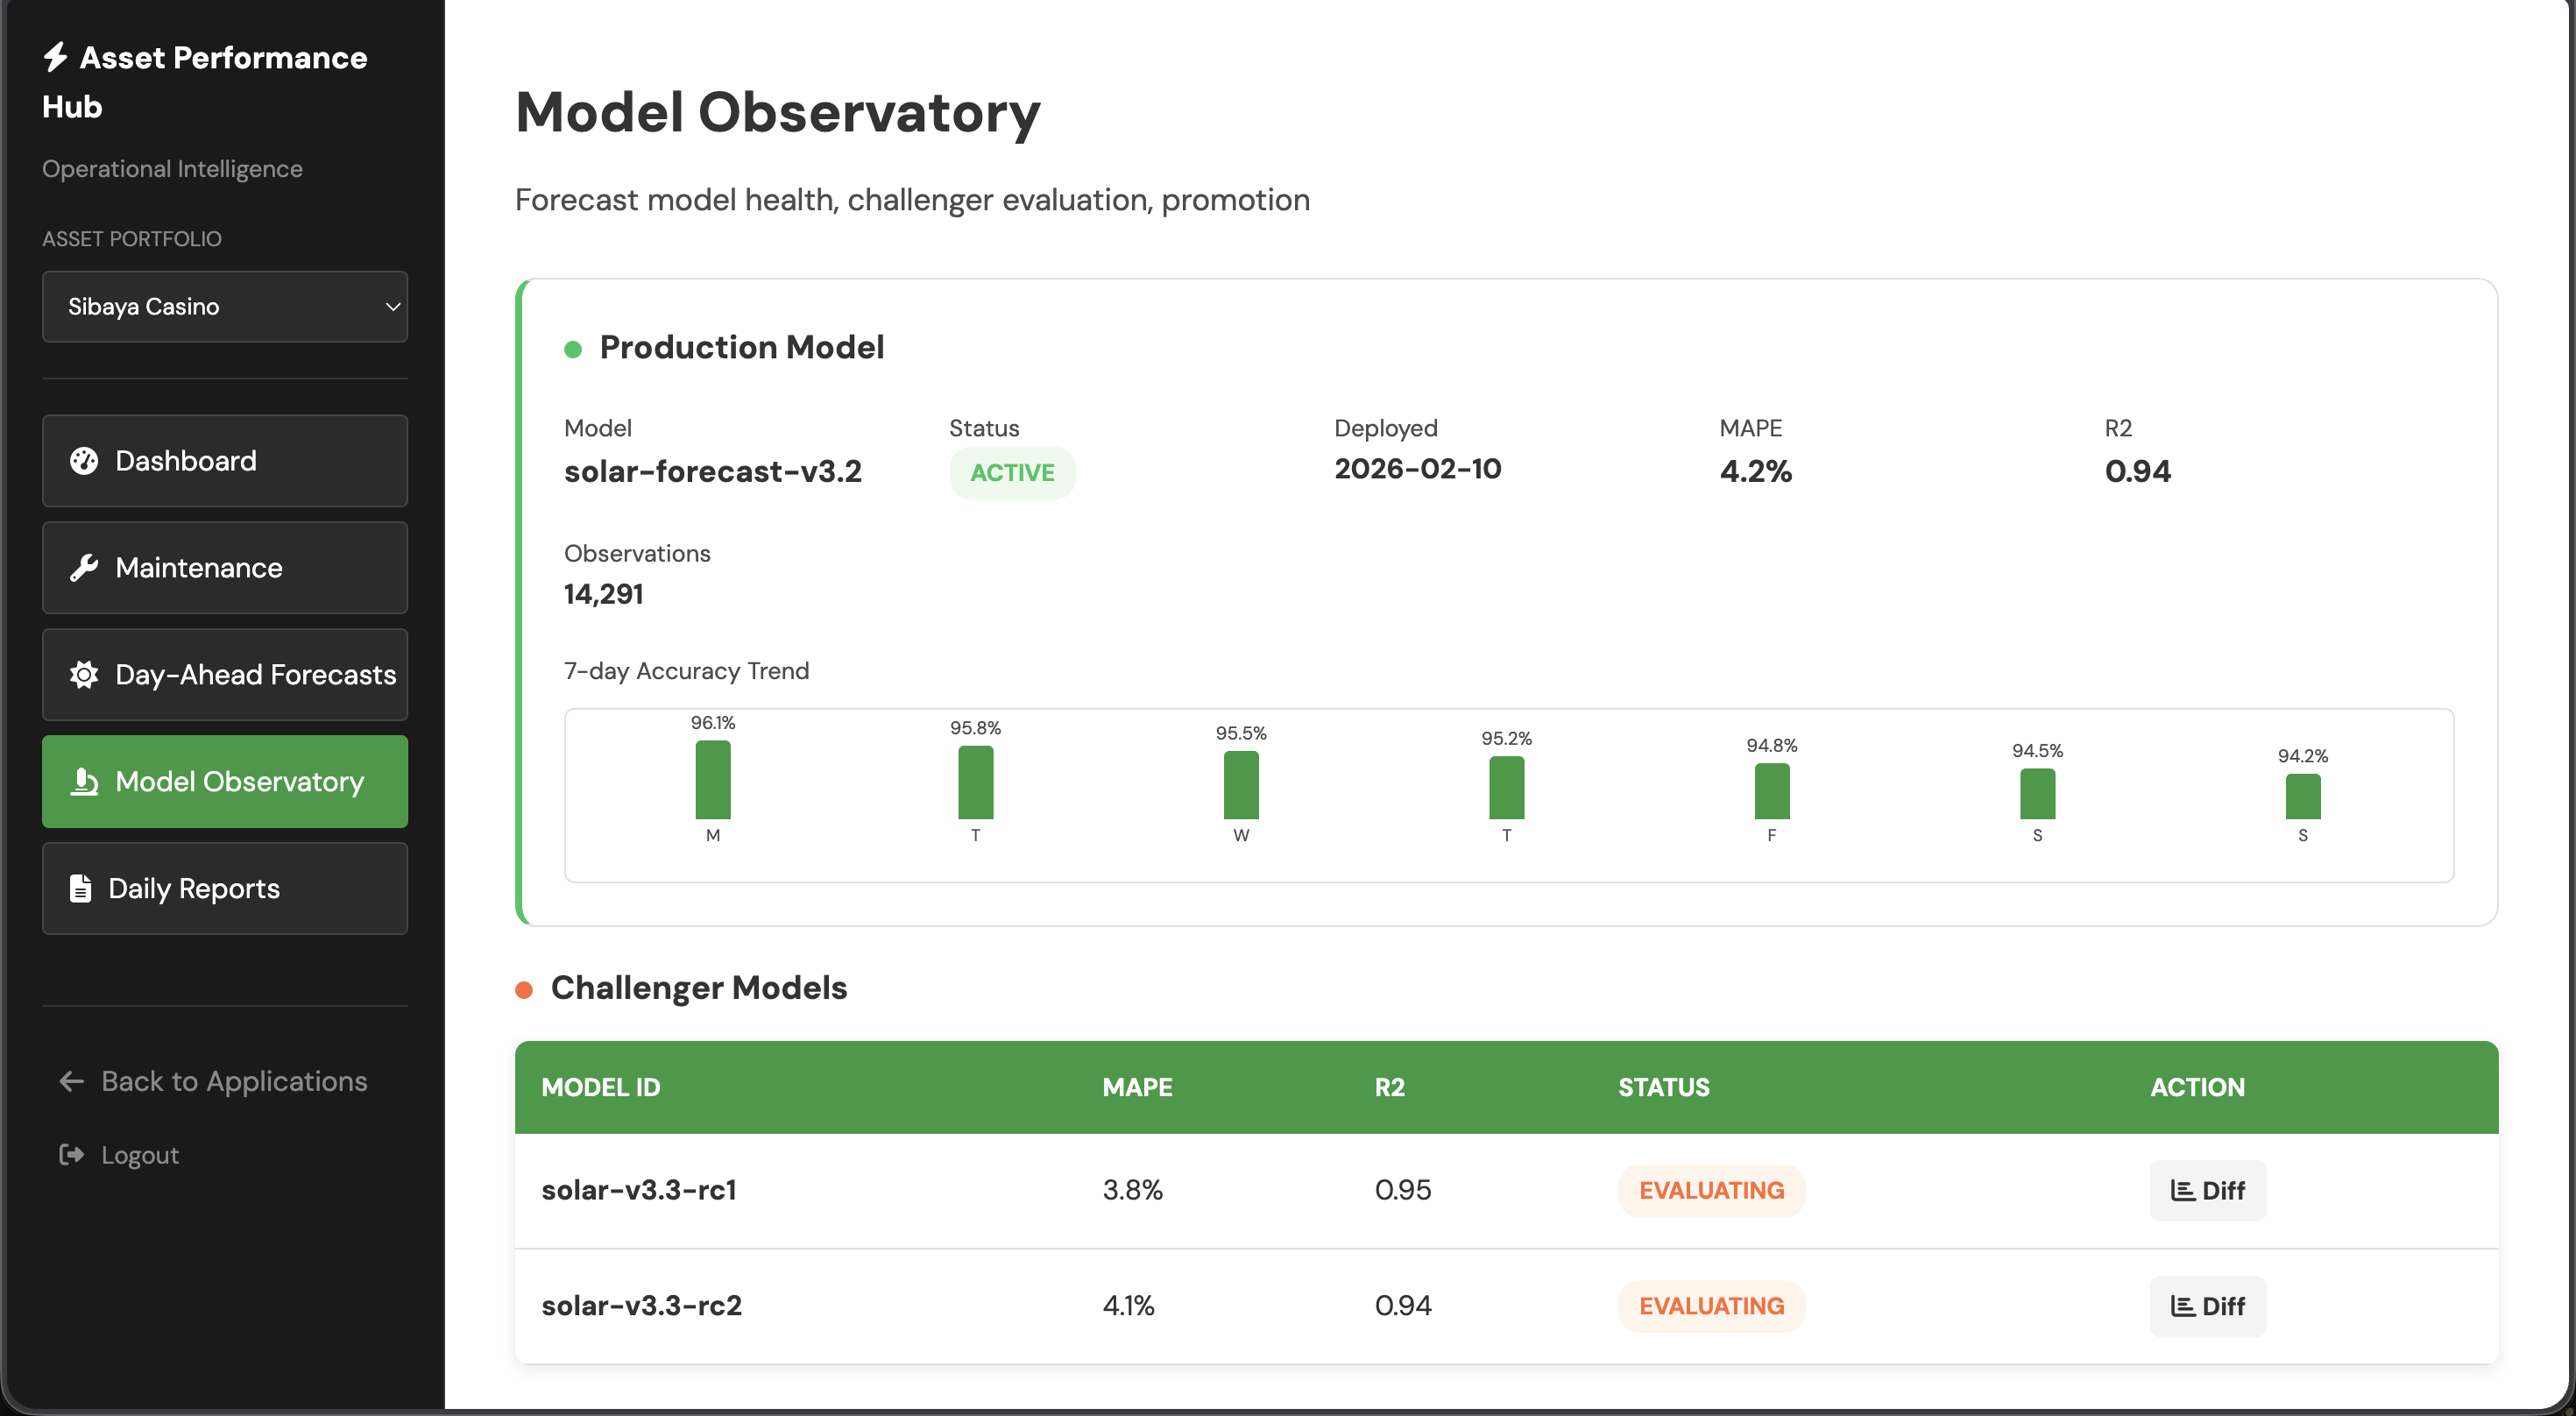
Before anomalies can be detected, the system must establish what normal production looks like. Ona trains a site-specific forecasting model on weather and production data, then uses the Model Observatory to evaluate challenger models side by side. The gap between the forecast and reality constitutes the Energy-at-Risk.
The primary model achieved an R² of 0.94 from just three months of historical data, with a 4.2% MAPE — predicting within 4.2% of actual production on clean days. Challenger models were evaluated at 0.95 and 0.94 R² for continuous improvement.
What Went Wrong
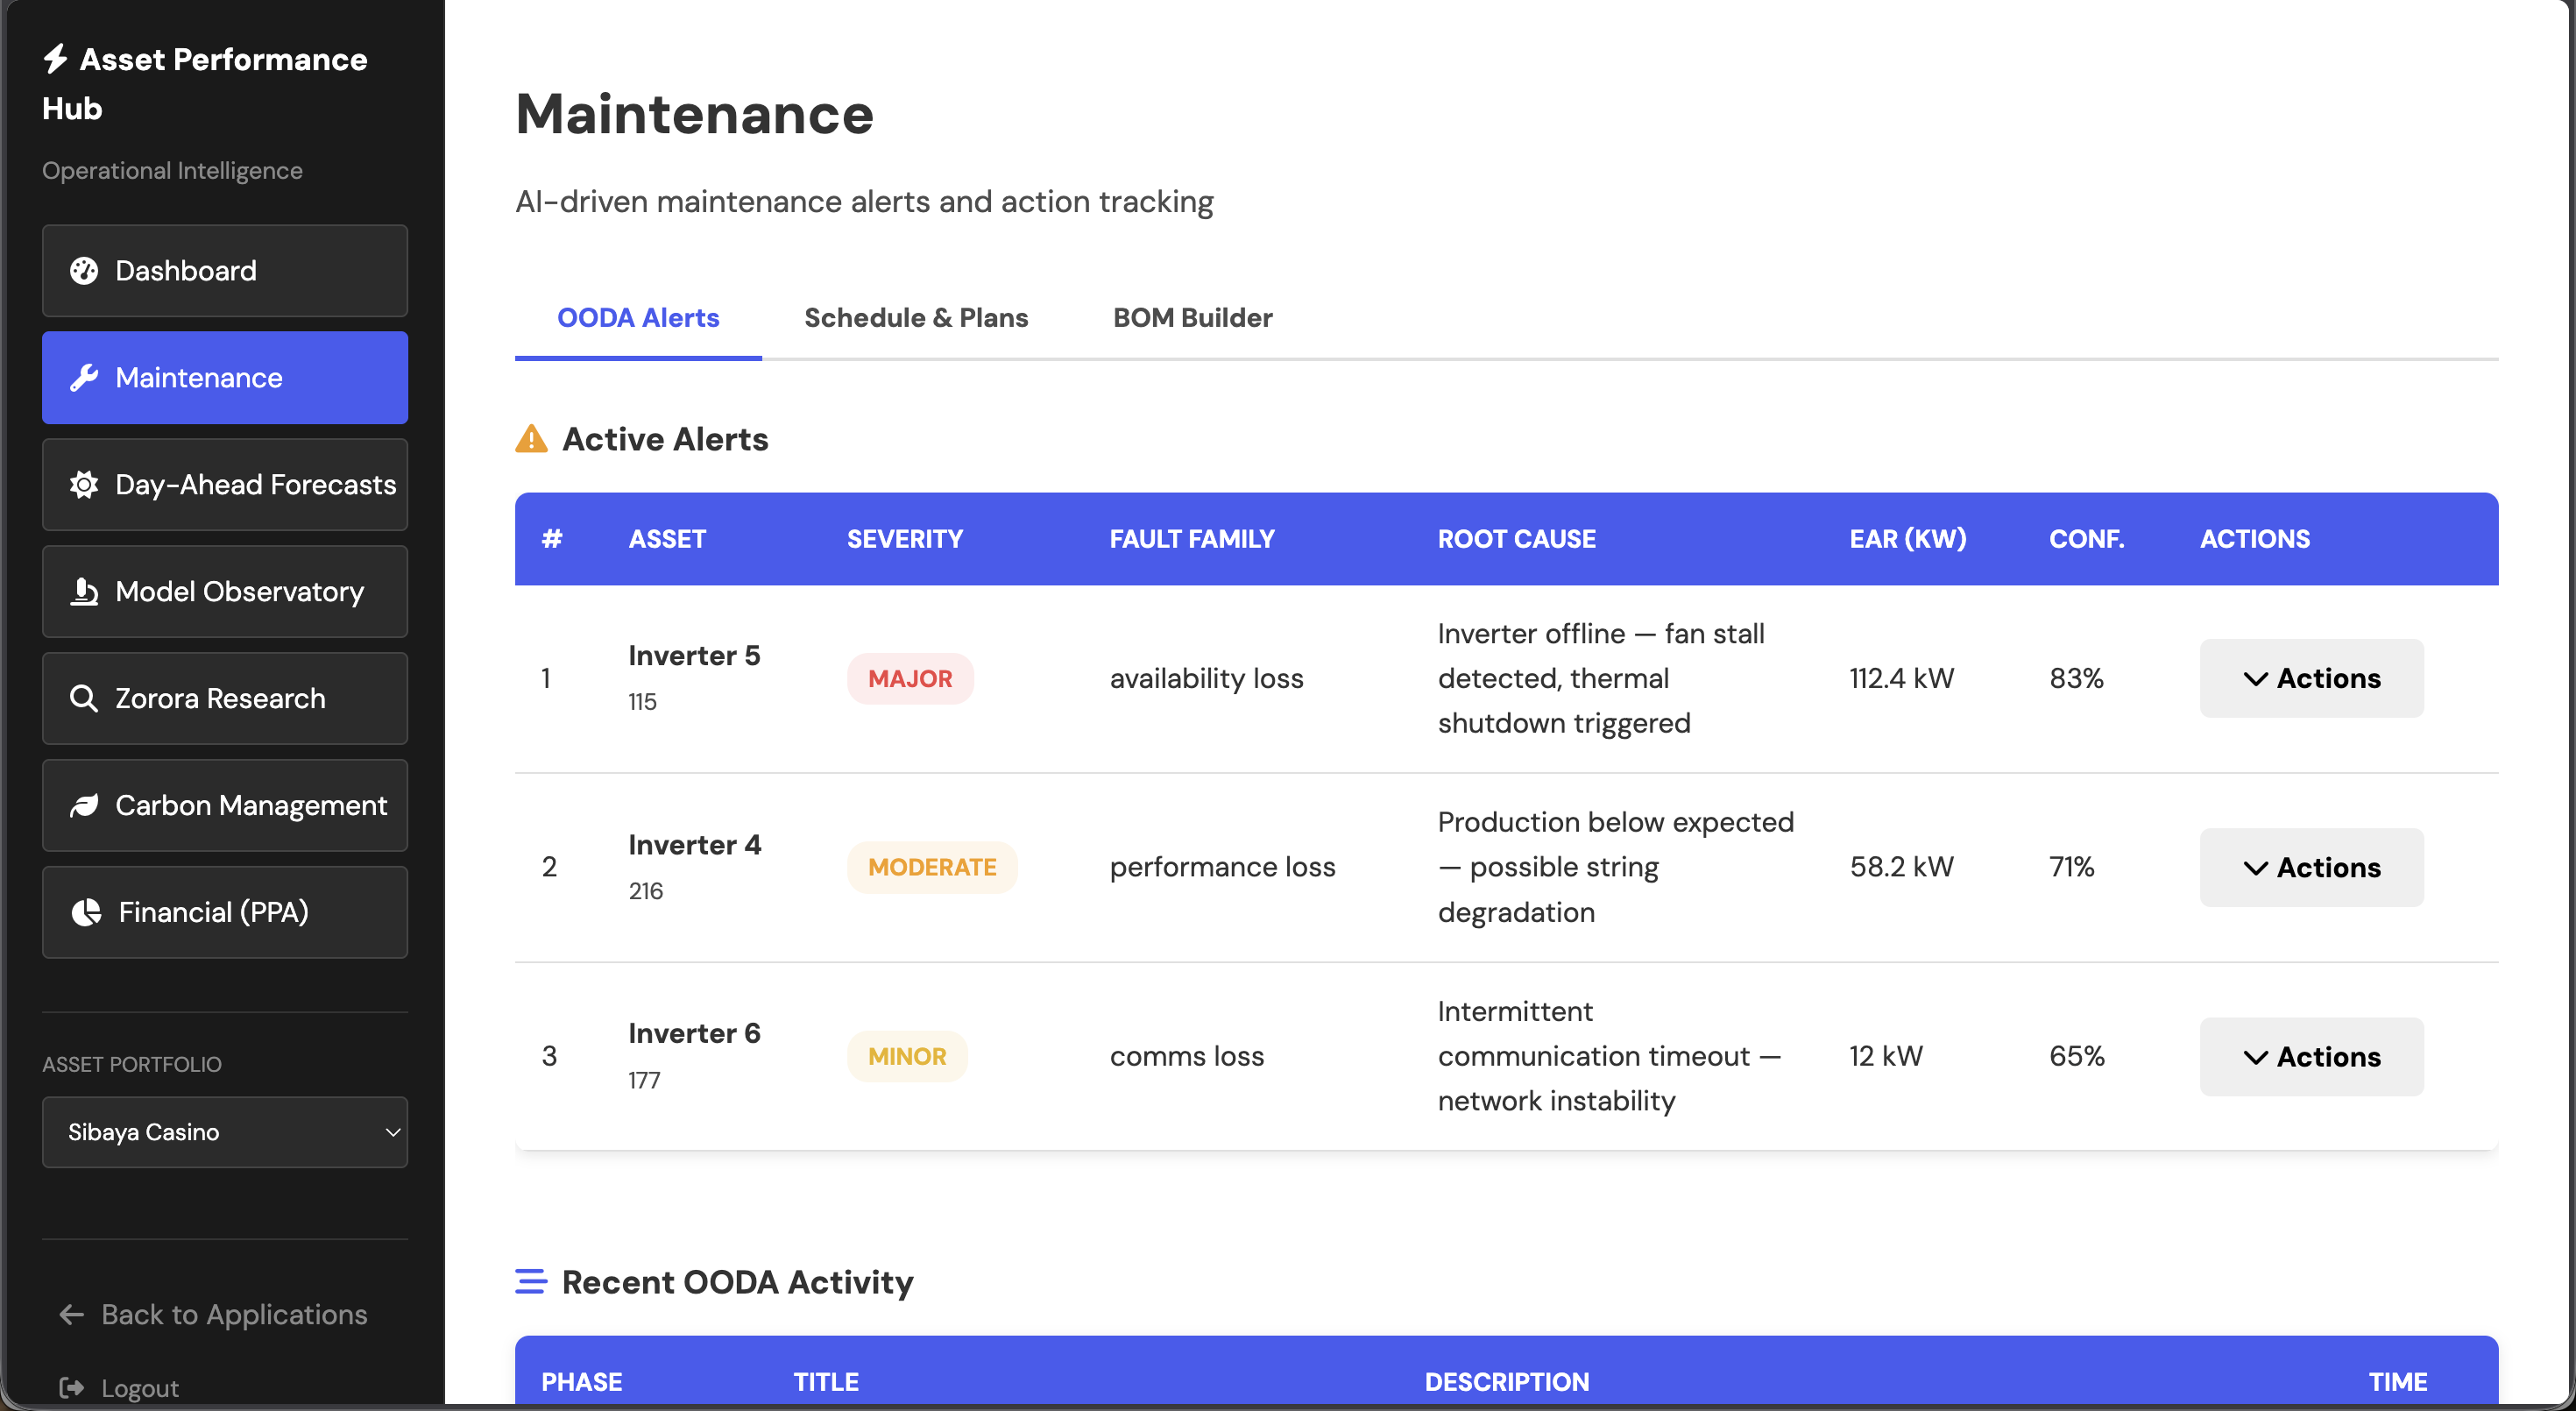
Every 15-minute interval where actual production falls below the forecast is classified by severity. Across the 88-day period, 14,642 anomaly events were detected and categorised into four severity tiers. Each anomaly generates a structured OODA-loop maintenance alert with root cause analysis, quantified EAR value, and recommended action.
| Category | Events | Description |
|---|---|---|
| Capacity Losses | 11,809 | Production below expected — soiling, shading, or degradation |
| Warning Events | 1,798 | Significant deviation requiring inspection |
| Critical Events | 931 | Severe underperformance — immediate action needed |
| Zero Production | 104 | Inverter offline during production hours |
Individual Inverter Performance
The EAR assessment decomposes site-level losses into individual inverter contributions, revealing which units need immediate attention. Four of seven inverters operated below the 80% contractual performance ratio target, with INV-190 at 54.9% as the primary loss contributor.
| Inverter | Performance Ratio | Availability | Fault Hours | Status |
|---|---|---|---|---|
| INV-190 | 54.9% | 88.2% | 126 | Critical |
| INV-191 | 71.3% | 94.1% | 62 | Below Target |
| INV-192 | 76.8% | 96.3% | 39 | Below Target |
| INV-193 | 73.5% | 95.0% | 53 | Below Target |
| INV-194 | 80.2% | 97.8% | 23 | On Target |
| INV-195 | 83.7% | 98.9% | 12 | On Target |
| INV-196 | 80.9% | 97.5% | 26 | On Target |
The Business Case
Not all losses require the same intervention. The EAR assessment models three recovery scenarios to help asset managers build maintenance business cases with quantified ROI. Each scenario projects the energy and revenue recoverable through progressively more comprehensive maintenance programmes.
| Scenario | Energy Recovered | Revenue |
|---|---|---|
| 50% Restoration | 112,439 kWh | $34,632 |
| 75% Restoration | 168,658 kWh | $51,948 |
| Full Restoration | 224,878 kWh | $69,264 |
Annualised loss projection: $69,264 — the cost of unnecessary grid spend if the 5.9 pp performance gap remains uncorrected.