
Turn Operational Data Into Carbon Intelligence & Revenue
The same SCADA data powering your forecasts also drives your carbon footprint, ESG reporting, and settlement certificates — no extra sensors, no additional integrations. Ona bridges physical generation to financial value.
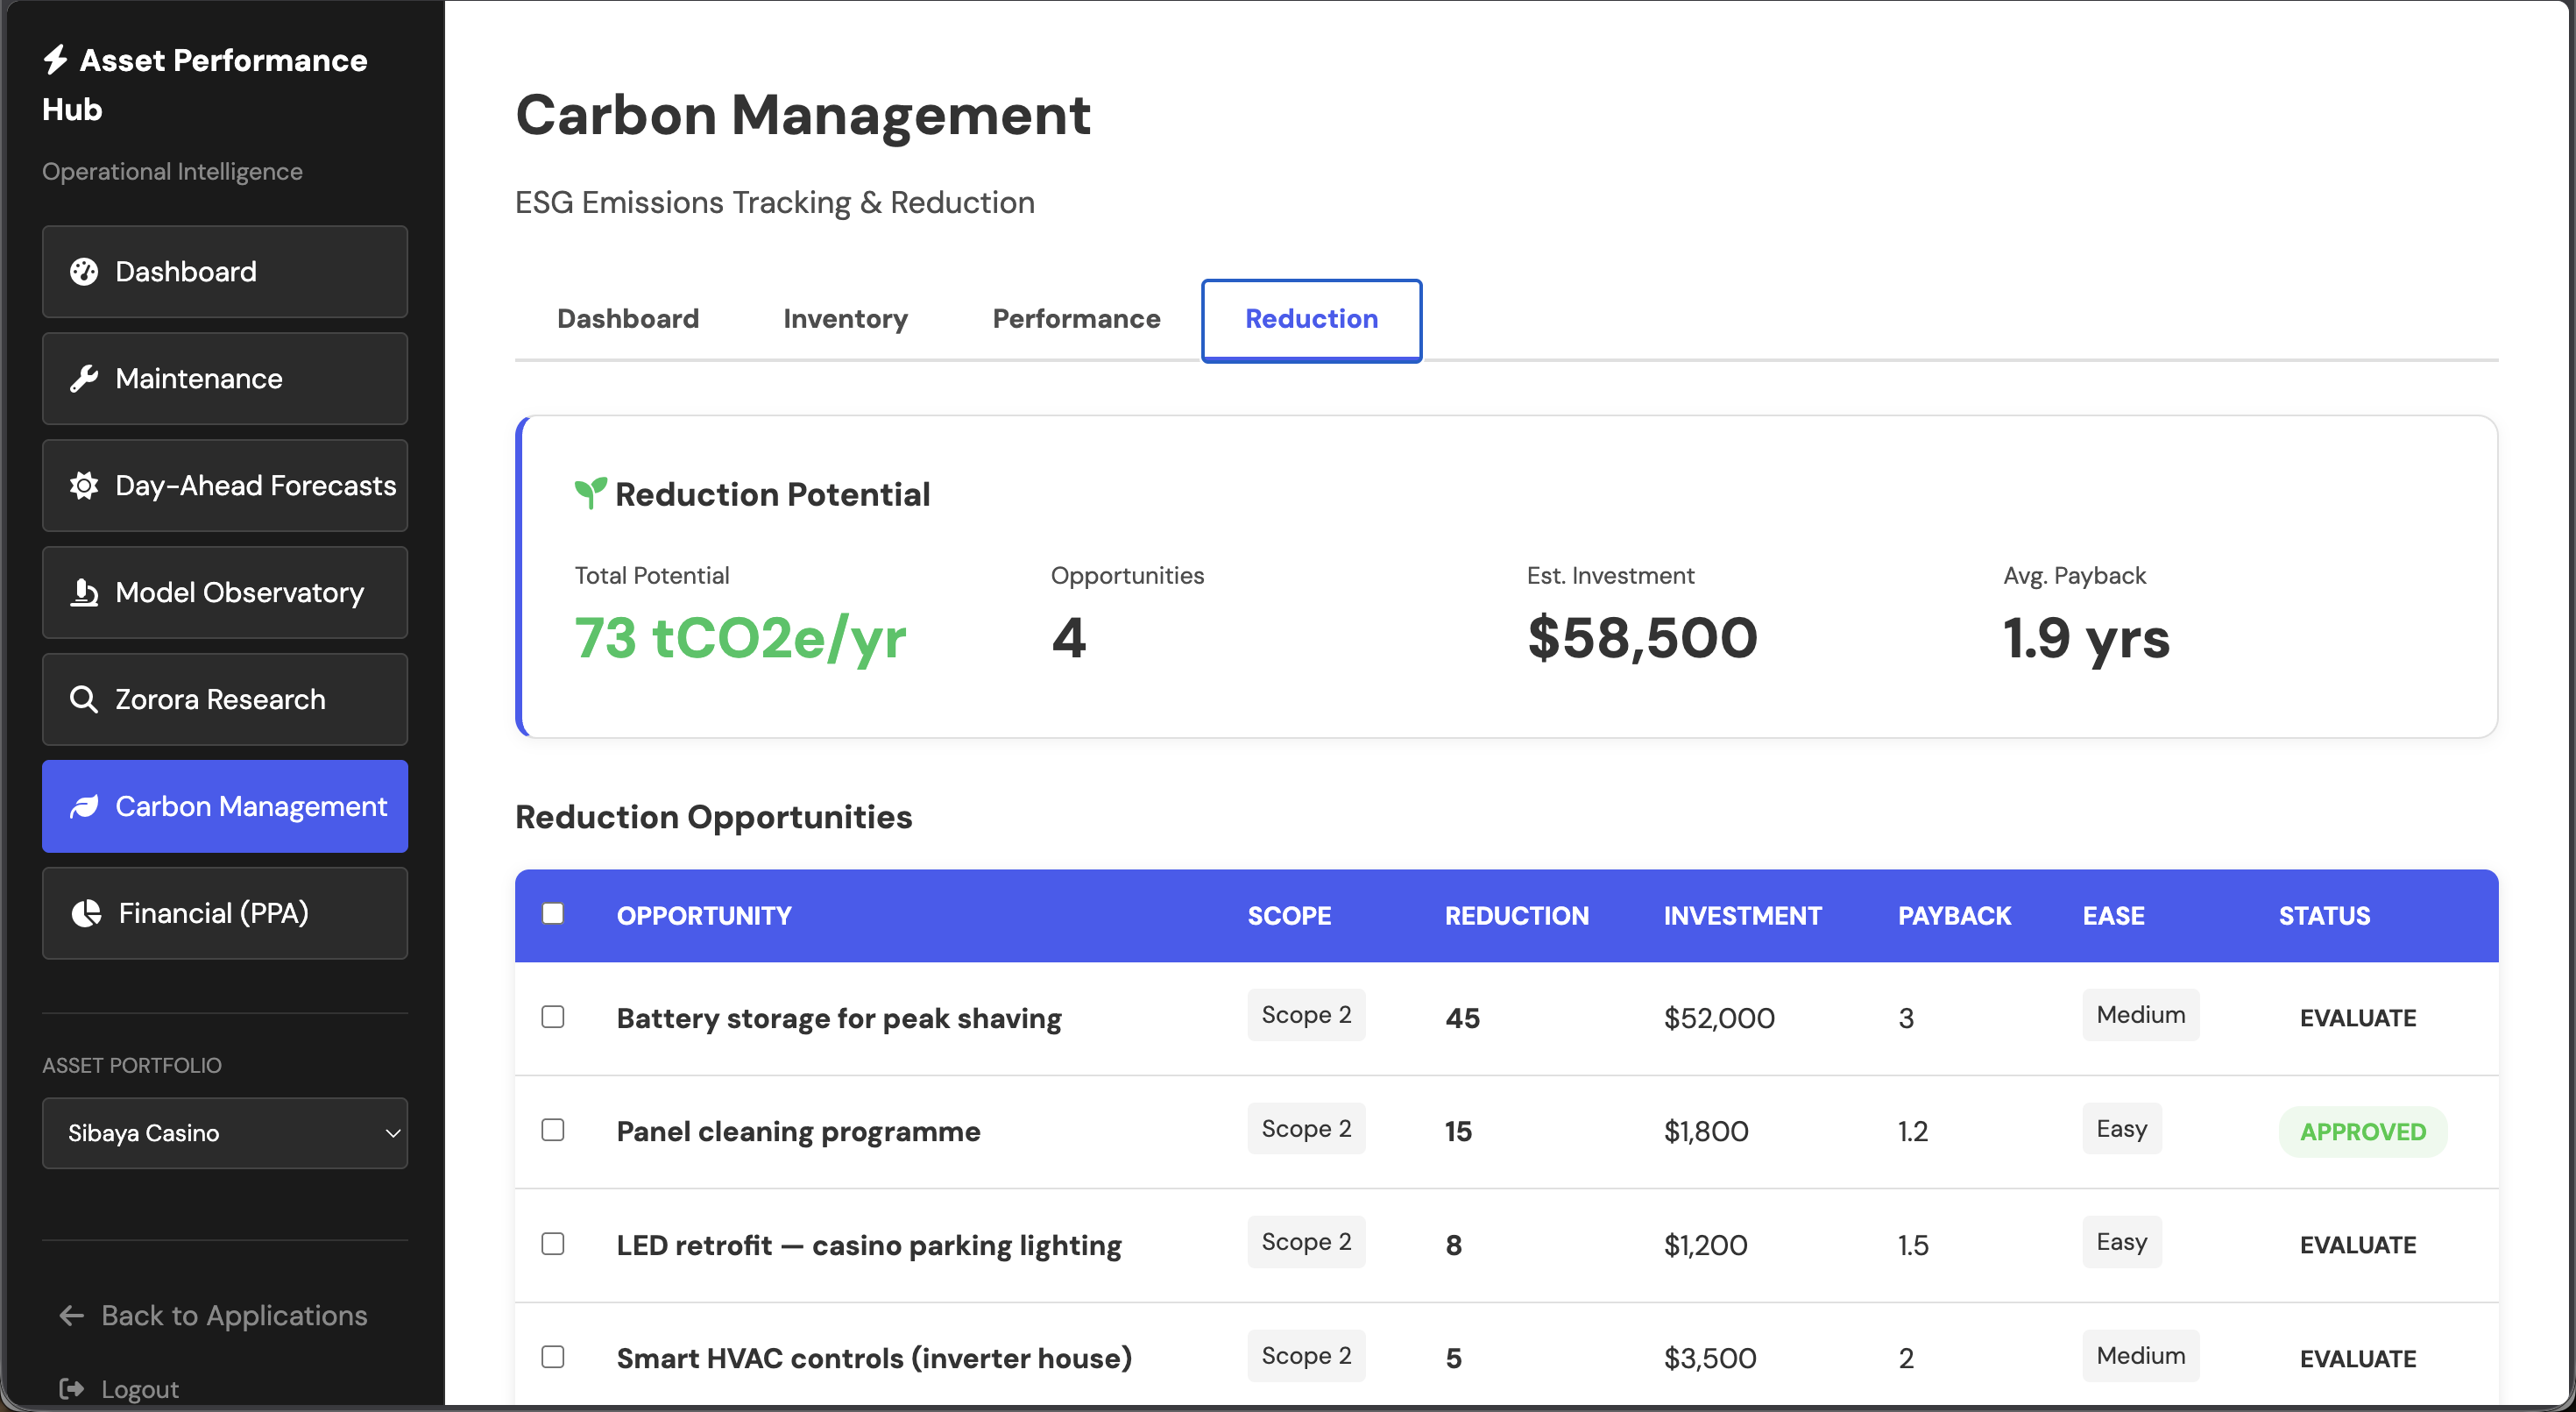
Carbon Management & ESG Reporting
Automated ESG compliance from the operational data you already collect. No extra sensors, no manual spreadsheets.
Investment-grade carbon reporting from existing SCADA data
The same telemetry streams powering your forecasts and anomaly detection also drive your carbon footprint. Ona calculates avoided emissions, generates compliance-ready reports, and ranks reduction opportunities by ROI.
- Automated ESG compliance reporting (EU SFDR, SEC climate disclosure) from operational data
- Reduction opportunities ranked by ROI, payback period, and ease of implementation
- Investment-grade carbon reporting for lenders, insurers, and investors
- Avoided-emissions accounting aligned with recognized carbon credit methodologies
Investor-Grade Performance Reporting
Give your CFO, lenders, and investors the numbers they need — automatically, without a separate reporting workflow.
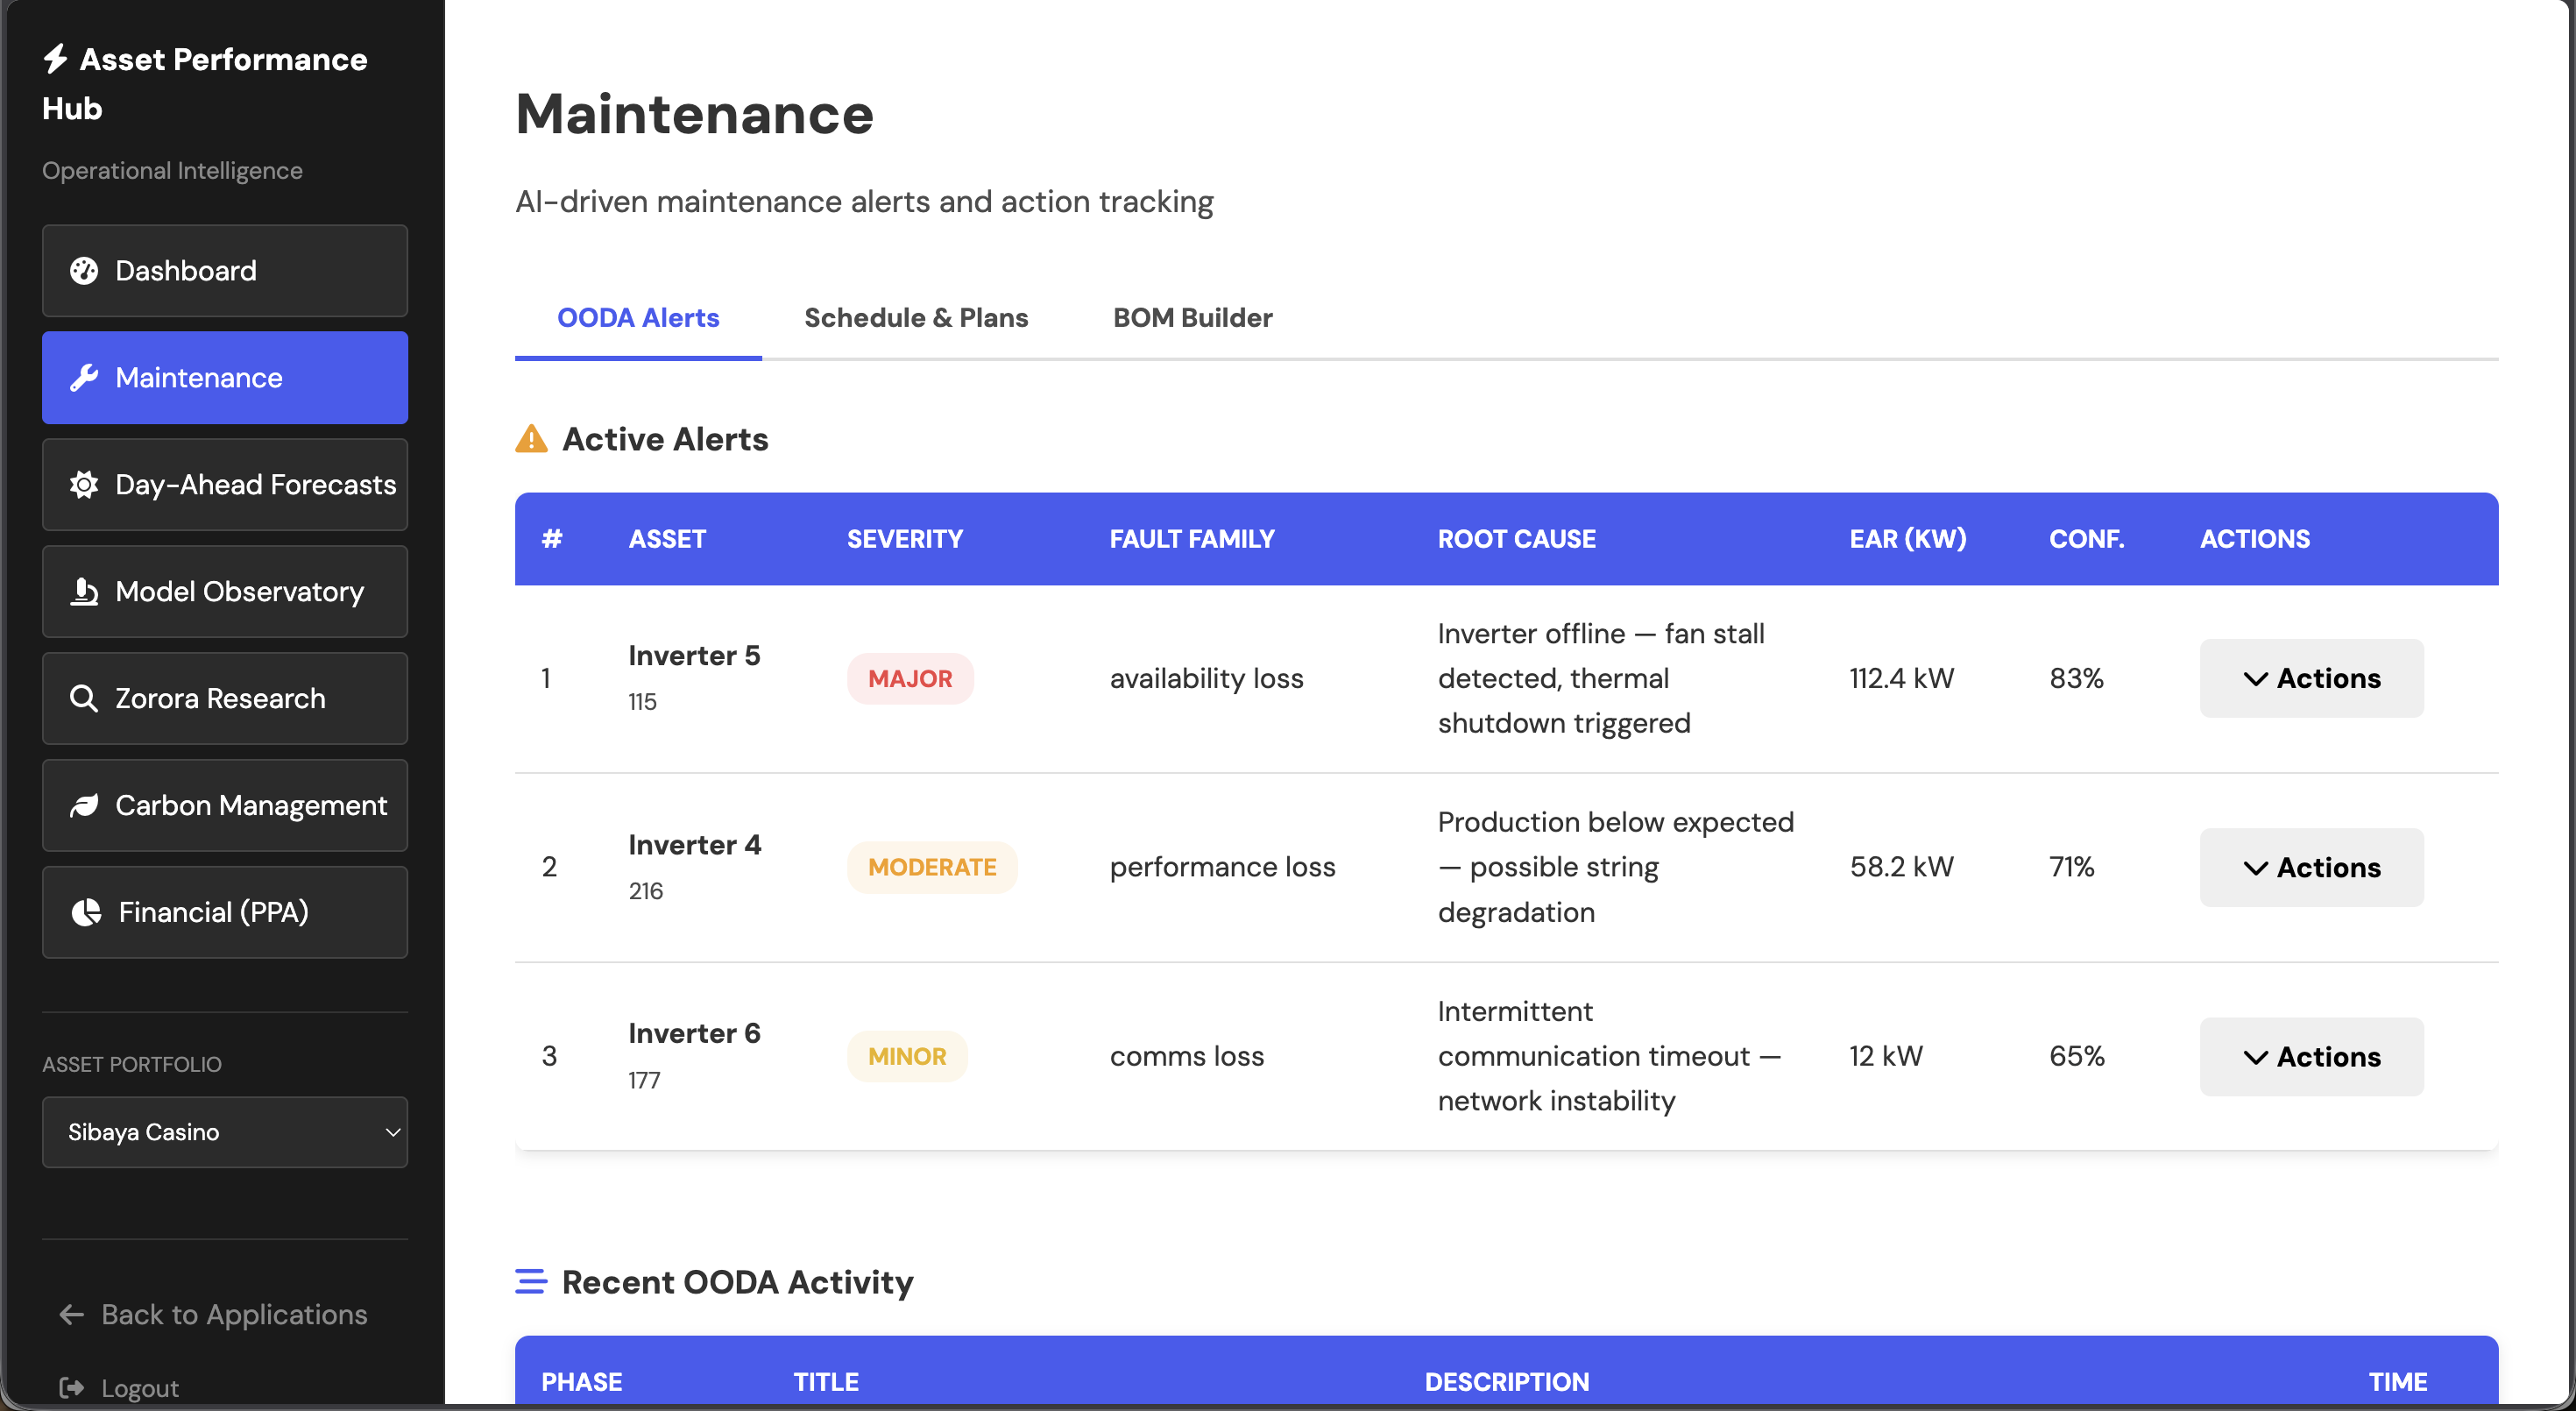
One source of truth across your entire portfolio
Stop reconciling fragmented OEM dashboards and manual Excel trackers. Ona consolidates cross-platform data into a unified, database-driven reporting layer that tracks actual generation against P50/P90 financial baselines.
- Automated investor reporting with weather-adjusted P50/P90 variance tracking
- Per-asset and portfolio-level performance attribution in your local currency
- Boardroom-ready PDFs suitable for lender reviews and insurer assessments
- IEC 61724 compliant methodology — suitable for warranty and insurance claims
Regulatory & Settlement Intelligence
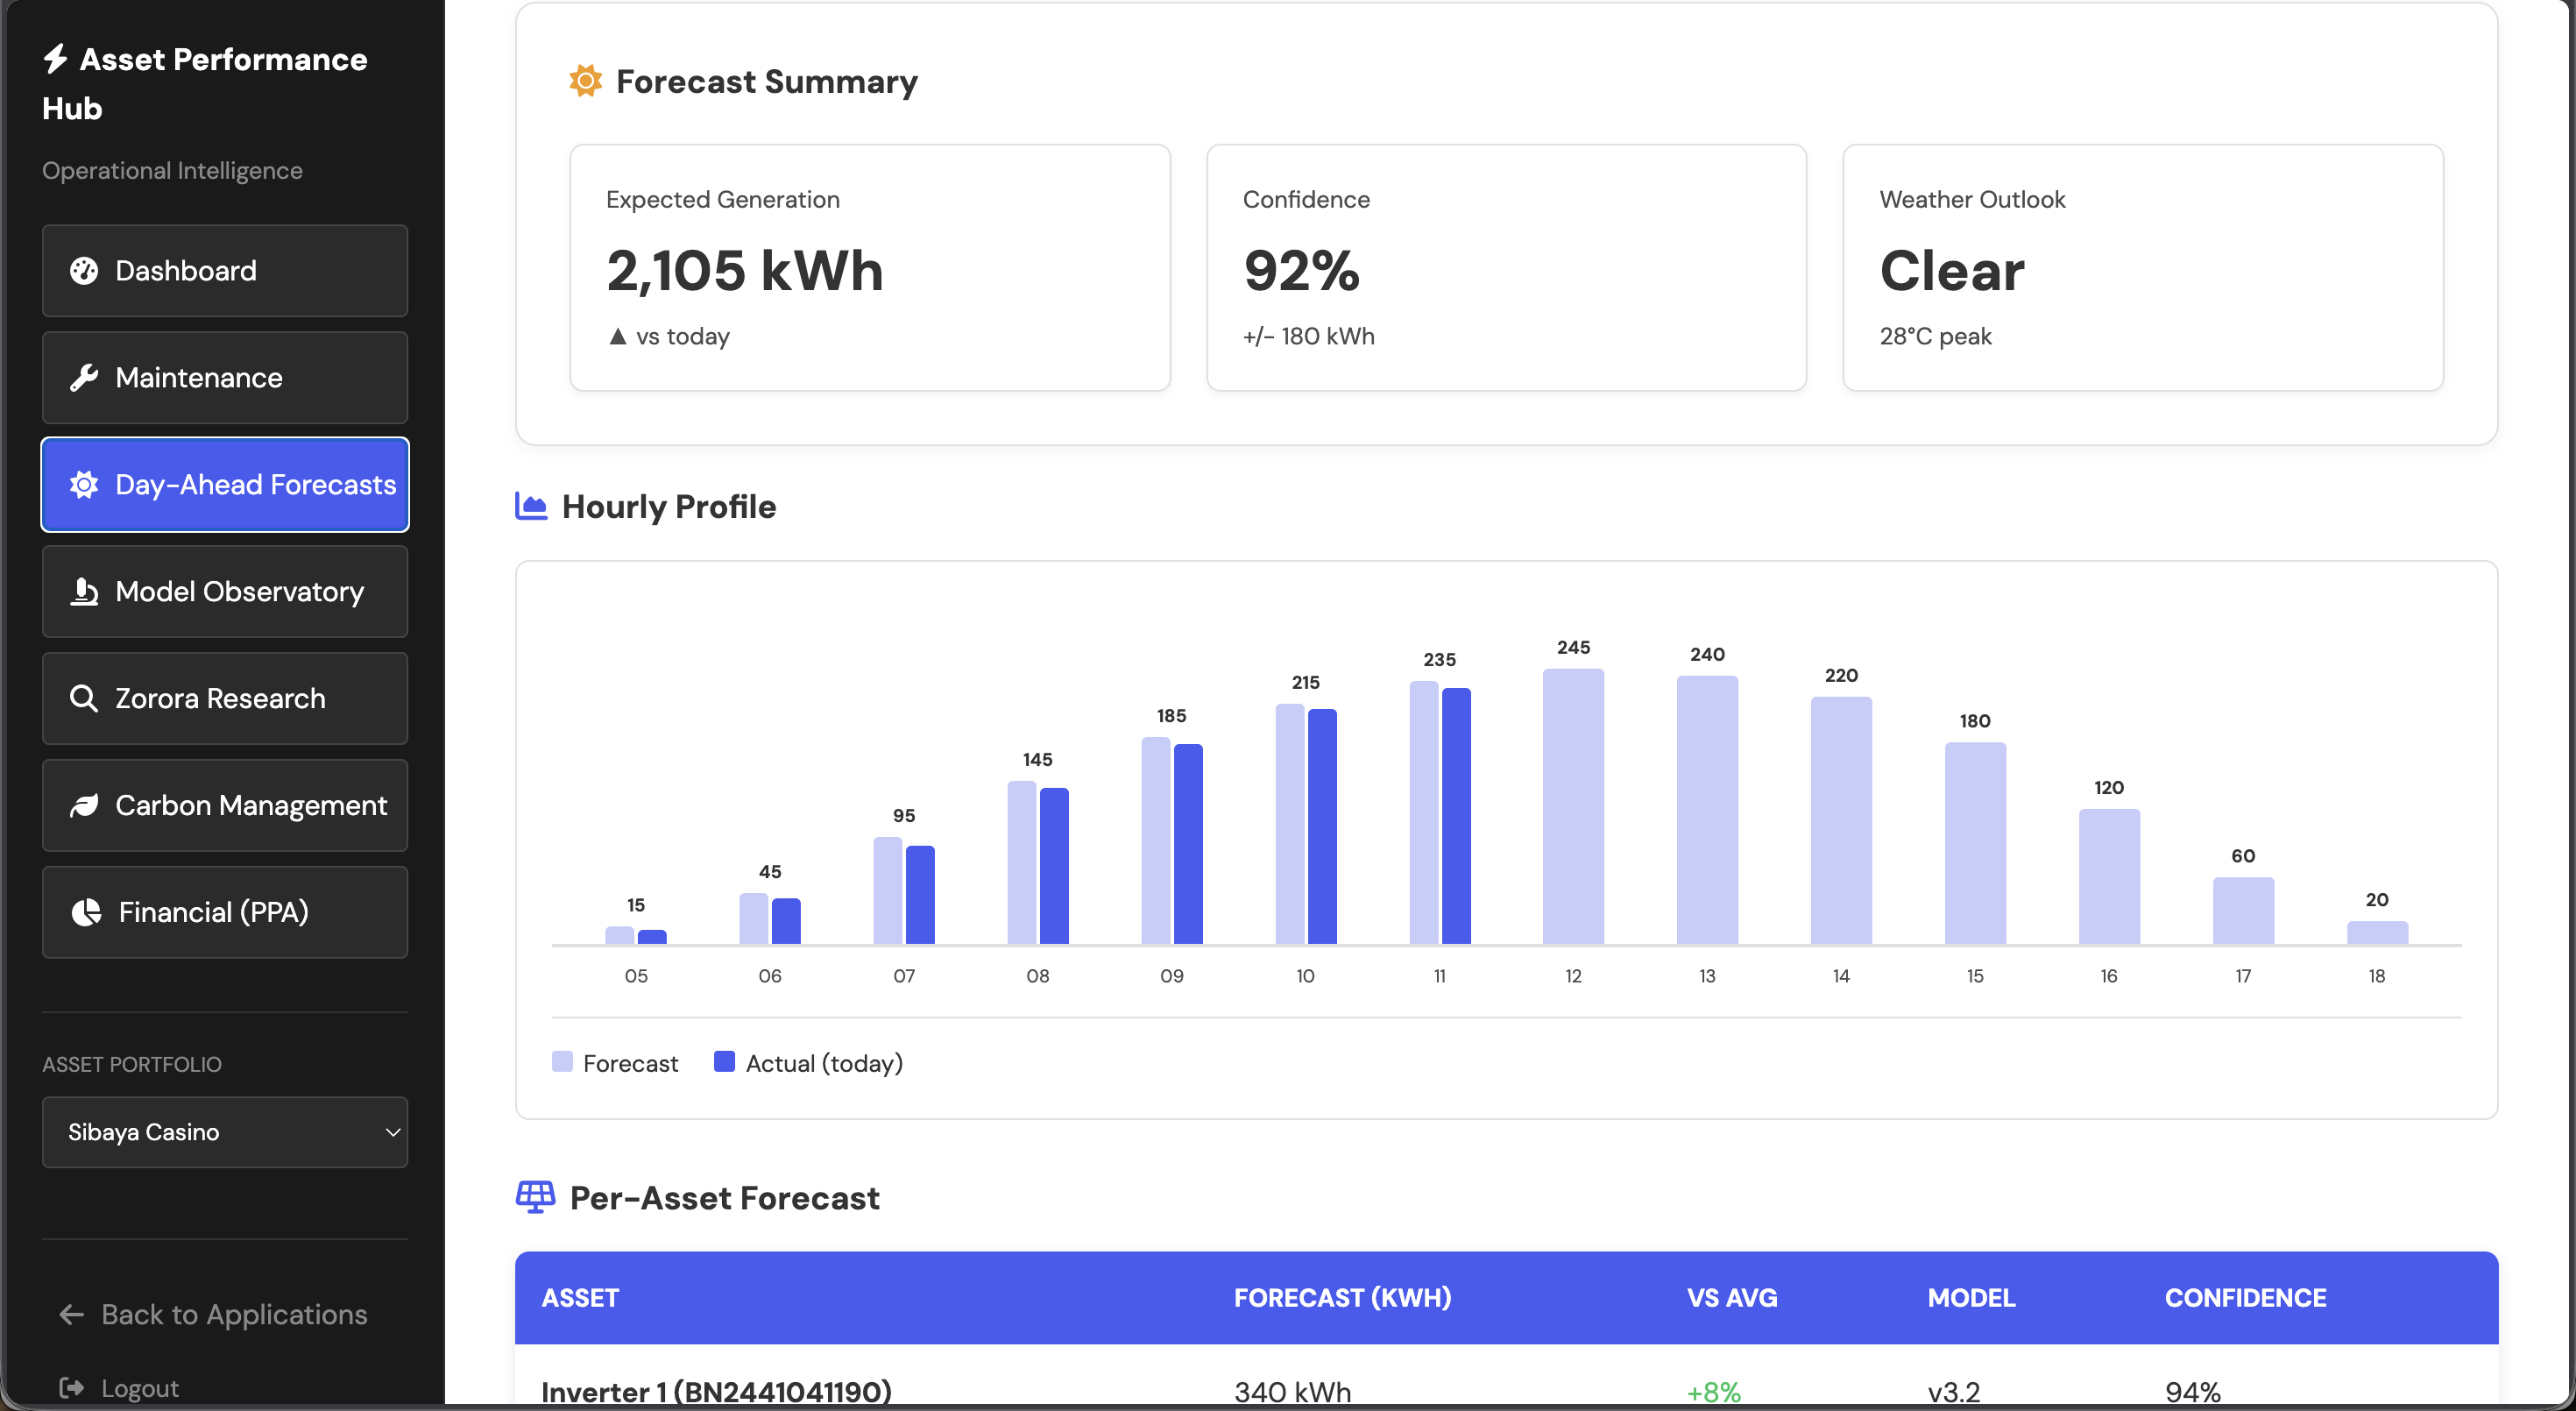
Bridge physical telemetry to financial settlement. Ona's Nehanda AI and Zorora RAG layer map raw meter data to wheeling certificates and billing reconciliation.
Automated wheeling certificates & billing reconciliation
Private energy wheeling under SAETA and NERSA requires precise half-hourly interval load profiles. Ona ingests raw utility meter data (Eskom AMR profiles), maps it to local tariff structures, and generates audit-ready settlement documents — turning spreadsheet chaos into machine-readable compliance.
- Parse complex interval utility files (Eskom AMR, municipal SSEG billing) into standardized schemas
- Automated wheeling certificate generation aligned with NERSA requirements
- Municipal billing reconciliation against actual generation data
- Nehanda 7B LLM parses regulatory gazettes and tariff updates into machine-readable parameters
One Unified Platform for Your Entire Portfolio
API-based integration works with your existing SCADA systems, meter exports, and reporting tools. Connect once, get carbon intelligence and settlement automation across your entire portfolio.
Weather Feeds
Utility Meters
Market Prices
Settlement
Intelligence
ESG Reports
Wheeling Certificates
Investor Reporting
Revenue Optimization
Access via UI and SDK
Operators use the Ona Platform dashboard. Engineers embed carbon intelligence, settlement automation, and monitoring directly into ERP, reporting, and custom workflows.
Dashboard & Tools
Carbon reports, ESG dashboards, settlement views, and investor-grade performance reporting — no code required.
- Carbon management & ESG reporting UI
- Per-meter anomaly monitoring & alerts
- Wheeling certificates & settlement reconciliation
Python & JavaScript SDKs
REST APIs and SDK clients for production integrations — compose telemetry, forecasts, OODA alerts, and Nehanda diagnostics into your existing stack.
Pricing
Start with per-meter anomaly monitoring. Add carbon, PPA, and trading modules as your monetization stack grows. Available via UI and SDK.
Per-Meter Anomaly Monitoring
Continuous physics-based anomaly detection across your inverter fleet. Get alerted before a hardware fault becomes a month of lost production — with automatic financial impact tracking in your local currency.
- 5-minute telemetry ingestion
- Physics-based fault detection
- Inverter state fault classification
- Email & webhook alerts
- Monthly delta performance report
- Rolling financial impact tracking
Add-On Modules
Extend anomaly monitoring with the monetization modules your use case demands. Each add-on layers on top of your existing telemetry — no new hardware, no re-integration.
- Carbon Monitoring — Scope 2 emissions tracking, carbon credit eligibility, ESG & investor reporting
- PPA Management — Power purchase agreement reconciliation, settlement-grade metering, offtaker billing
- Trading & Settlement — Wheeling certificate generation, trading interval dispatch optimization, regulatory settlement intelligence
All monitoring and add-ons run on the Open Data Schema for Energy (CC-BY-SA / Apache 2.0). Install the standard for free. When you're ready for continuous anomaly detection and monetization, it scales up with zero integration cost.
Proven Results in Production
We don't just promise intelligence — we validate it across severe data challenges and complex settlement environments.
Gweru Gold Mining
Problem: Only 6 months of historical data for 2.31 MW solar plant — insufficient for bankable revenue projections.
✓ Enabled investor-grade yield forecasting with limited data
Cummins Portfolio
Problem: Severe data loss — 65% missing data points made revenue reporting impossible.
✓ Zero grid violations
✓ 96% faster fault detection despite infrastructure failure
Avaron Infrastructure
Problem: Coordinating Owner, O&M contractor, and Insurer across sites with conflicting data.
✓ Economic optimization now considers insurance impact of maintenance timing
Ready to Unlock Value From Your Assets?
Start with a technical assessment. We'll map your current carbon reporting gaps and show you exactly what unified monetization intelligence delivers.
13-week validation pilot. If we don't hit 2 of 4 key metrics (Latency, MTTR, False Positives, Data Completeness), you get a full refund.