
Catch the Fault. Skip the False Alarm. Get the Fix.
Static threshold rules can't tell a failing inverter from one running fine under cloud cover — so teams drown in false alarms until they learn to ignore the dashboard. Asoba instead builds a behavioral model of each asset's own normal operation, scores deviations continuously instead of flagging on/off, and hands your team a cited fix pulled from your own OEM documentation — not another alert to triage.
From Anomaly to Action, Automatically
Four steps, no manual dashboard-correlation in between.
Learn Normal Behavior
A behavioral model is built for each inverter individually, conditioned on weather and time of day — not one fixed rule applied fleet-wide. What counts as "normal" for a shaded rooftop unit and a fully exposed ground-mount unit is learned separately, because it isn't the same.
Score the Deviation
Deviation from expected behavior becomes a continuous severity score and a streak length, not a single on/off flag. Your team can prioritize the handful of detections that matter instead of triaging every alert equally — including the ones caused by a cloud, not a fault.
Ground the Fix
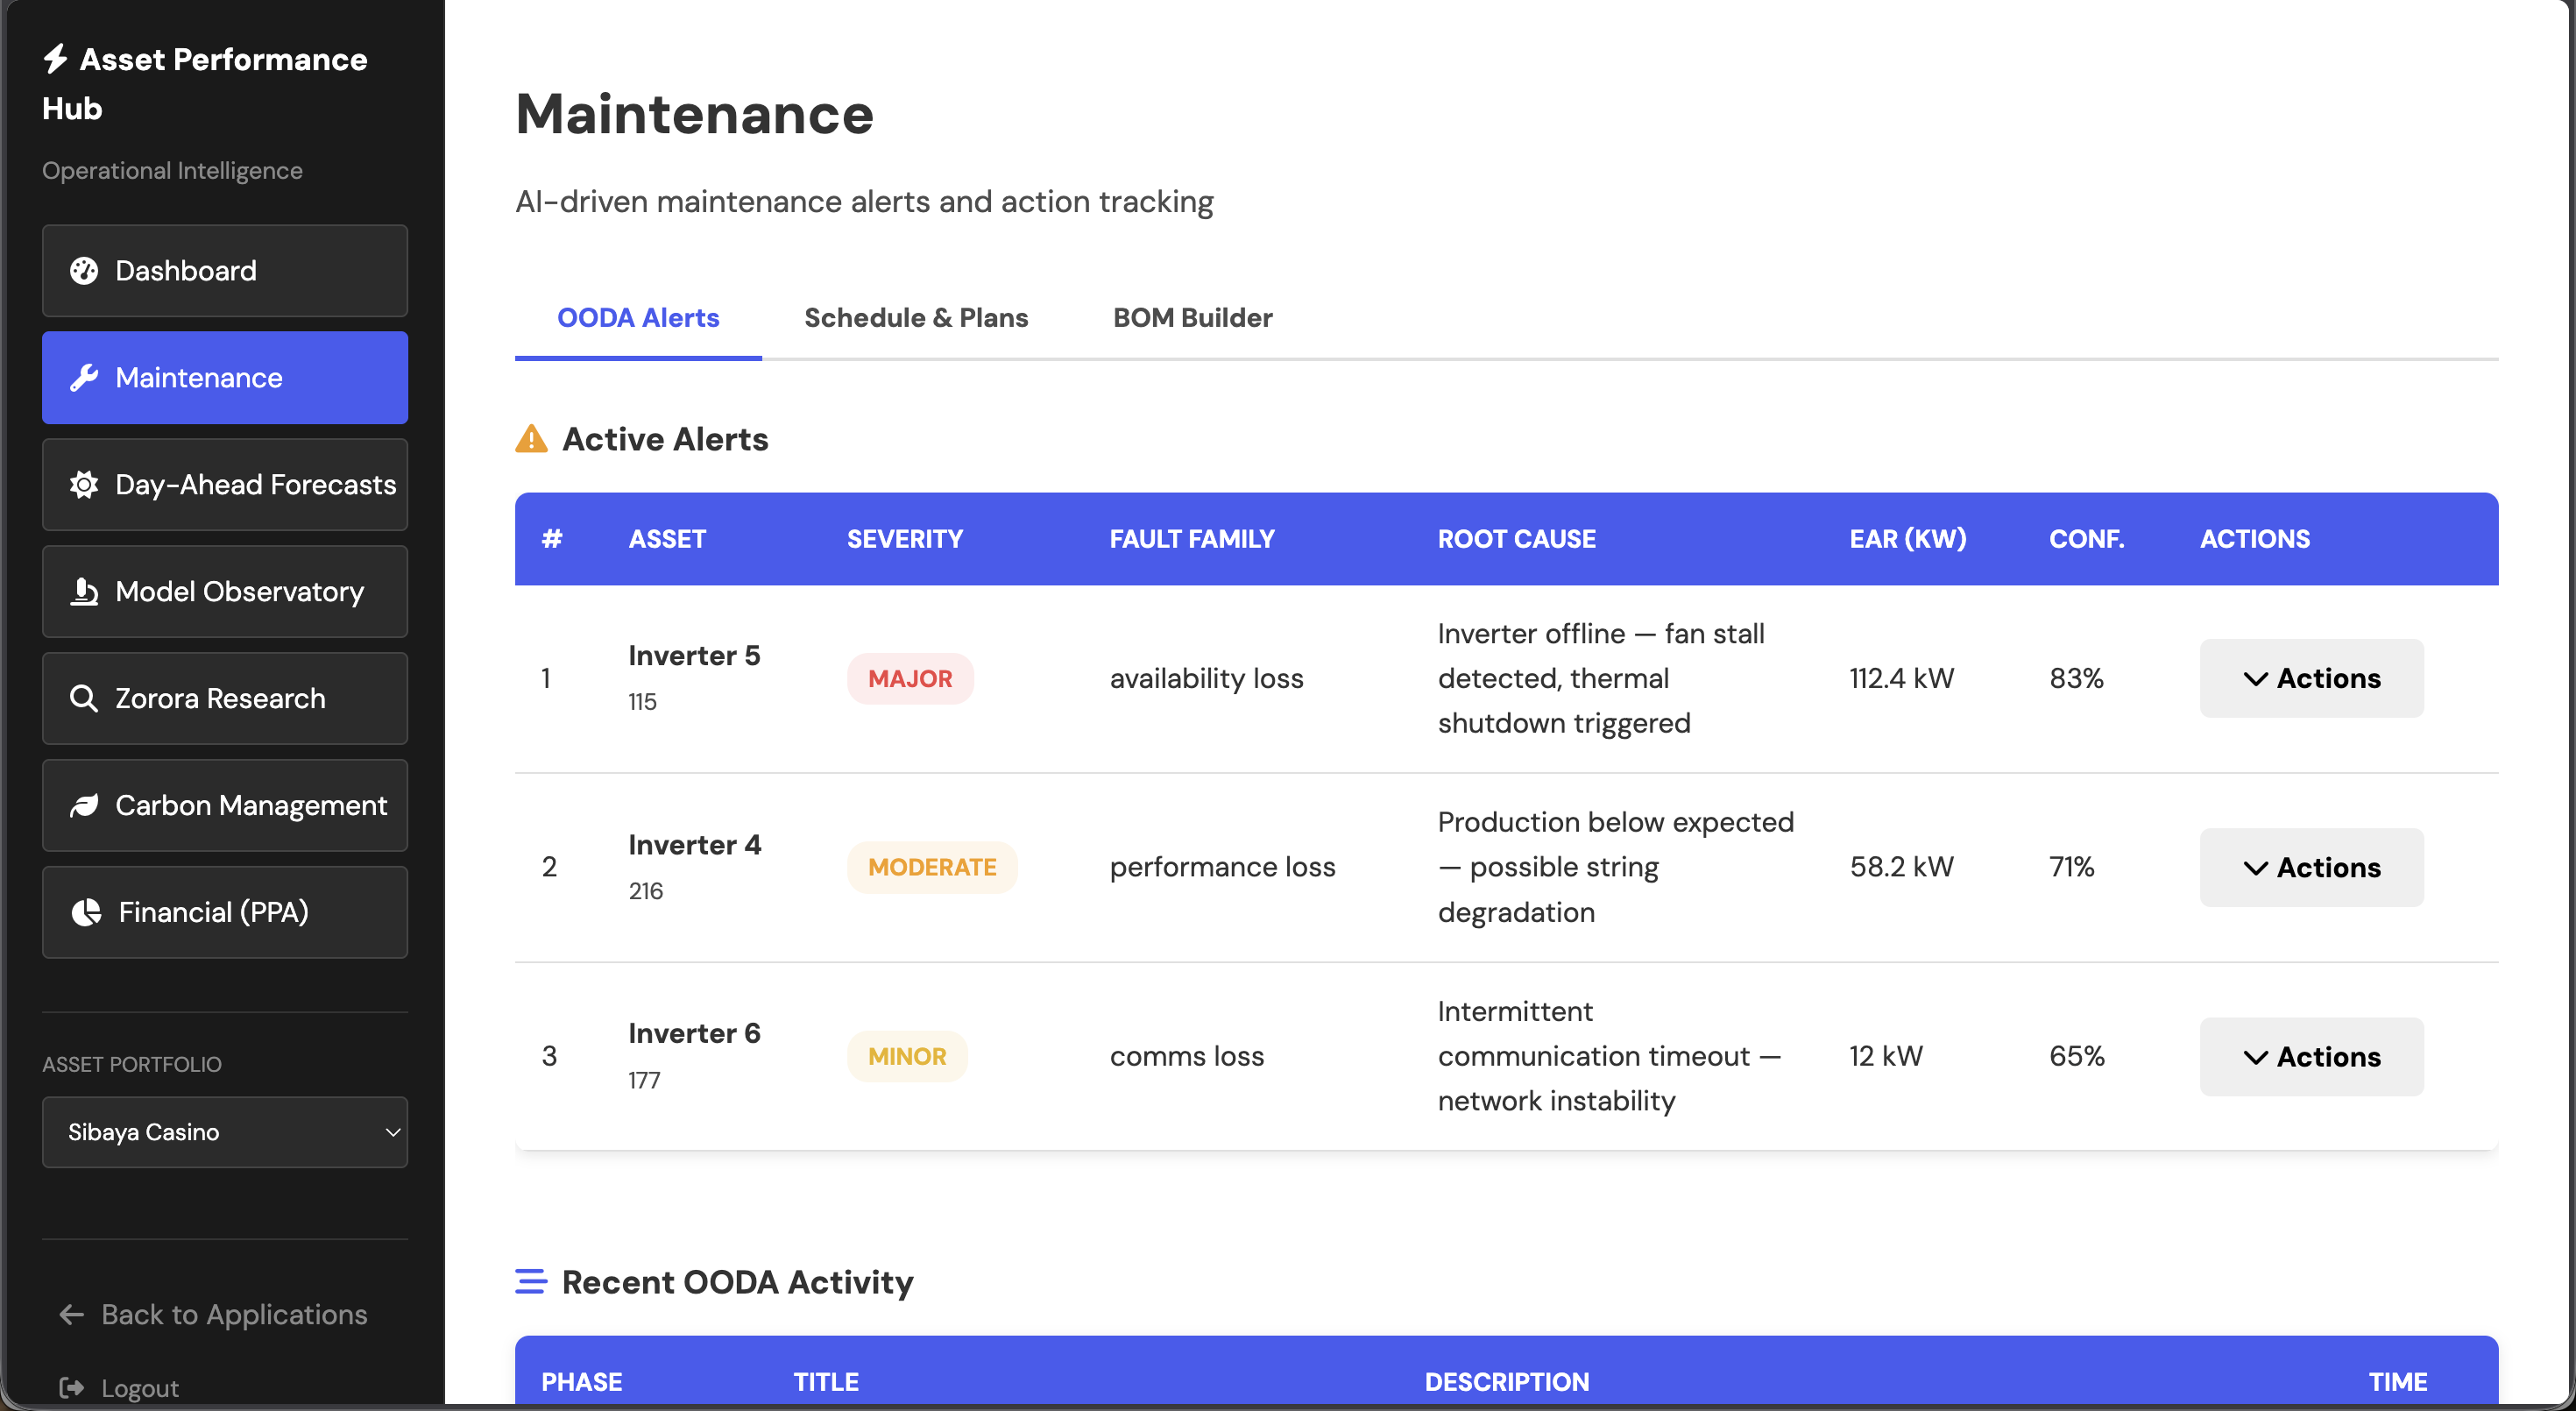
High-confidence detections are matched against your own OEM manuals, troubleshooting guides, and maintenance history, then synthesized into a cited recommendation by Nehanda v3 — a model fine-tuned specifically to cite its sources and refuse to fabricate a fix it can't support.
Route to Your Team
The anomaly score and the recommendation stay separate from any automated dispatch action. A deterministic downstream layer decides what happens next, so the control loop stays auditable and free of generative-model guesswork where it matters most.
Proven on a Live Fleet
Tested Against Real Faults, Not a Lab Benchmark
Evaluated across seven inverters on a 2+ MW commercial rooftop site over six months of production telemetry, benchmarked directly against the site's existing rule-based alerting — not a synthetic dataset built to flatter the model.
- 216 labeled faults caught on the fleet's highest-signal inverter, at a 41–56% precision and recall lift over rule-based thresholds
- Two inverters showed weak signal during evaluation — diagnosed as an upstream data-backfill gap, not equipment failure, before it was ever forwarded as a false lead
- Same production platform, security model, and validation pipeline used for a pilot as for ongoing monitoring — nothing stripped down to run a trial
Built for Your Engineering & Security Team
The pilot runs on the same platform, security model, and validation pipeline as ongoing monitoring — nothing about a trial is a stripped-down version of the product.
Deployment
- Serverless, event-driven architecture — auto-scaling, no idle-cost overhead
- In-region processing for local data residency requirements
- Failure domains are isolated: an issue in one ingestion pipeline can't cascade into the detection engine
Data & Governance
- Multi-OEM ingestion into a canonical schema — no manual spreadsheet wrangling on either side
- Row-level, cryptographically enforced tenant isolation
- Every access and manual override captured in an audit trail; infrastructure benchmarked weekly against CIS, ISO 27001, and SOC 2 controls
Free 3-Week Diagnostic Pilot
See Your Fleet's False-Alarm Number, Before You Commit to Anything
Send at least three months of inverter or SCADA production data (15-minute intervals ideal) and basic site details. We'll tell you within the first week whether your data clears the bar to start — and if it doesn't yet, we'll say so up front rather than take your data and hand back a weak answer.
- No on-site visit, no new hardware, no engineering time from your team
- No cost, and no obligation to continue afterward
- Your data stays in-region and isolated for the duration of the pilot; request full deletion anytime after
Stop Learning About Faults From a Shortfall Report
See how per-asset fault detection and cited troubleshooting recommendations fit into your existing monitoring stack.