Upload your SCADA data. Get AI-powered trading signals, risk analytics, and performance intelligence within 24 hours.
Stop managing disconnected systems. Get unified intelligence that maximizes revenue, minimizes risk, and optimizes uptime.
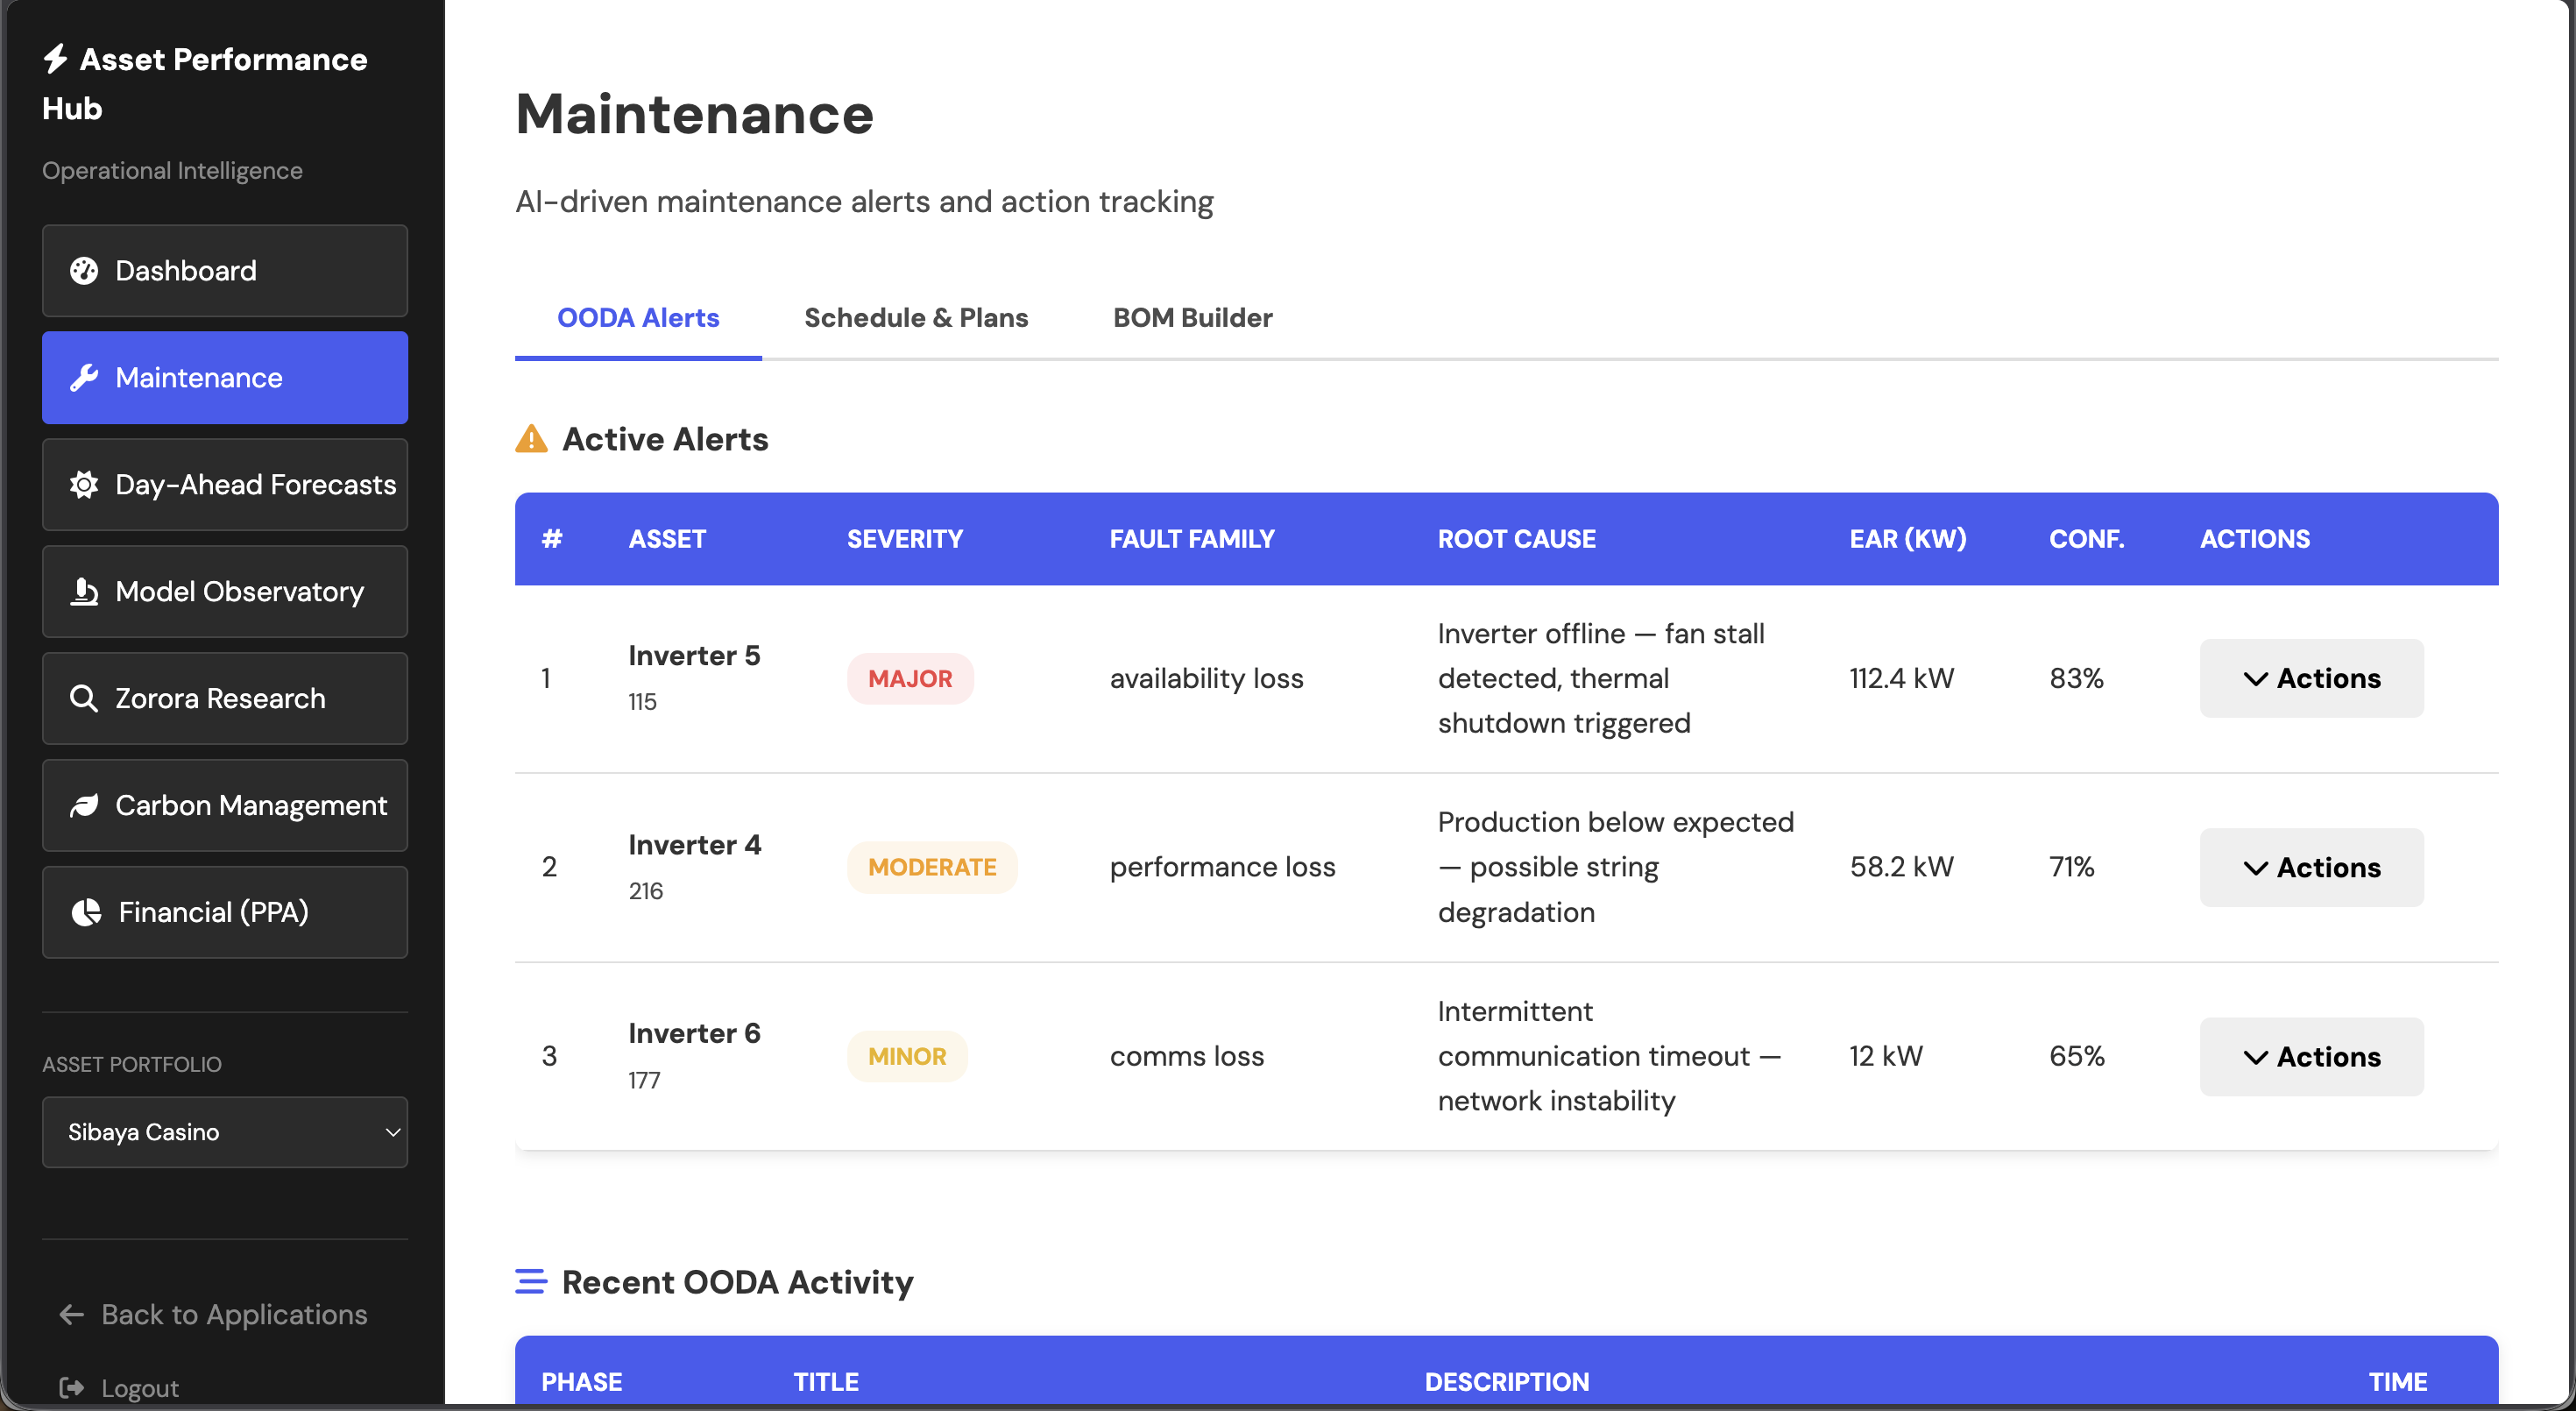
Catch faults before they become failures. AI-driven anomaly detection identifies degradation patterns across your fleet and generates maintenance plans with quantified energy-at-risk.
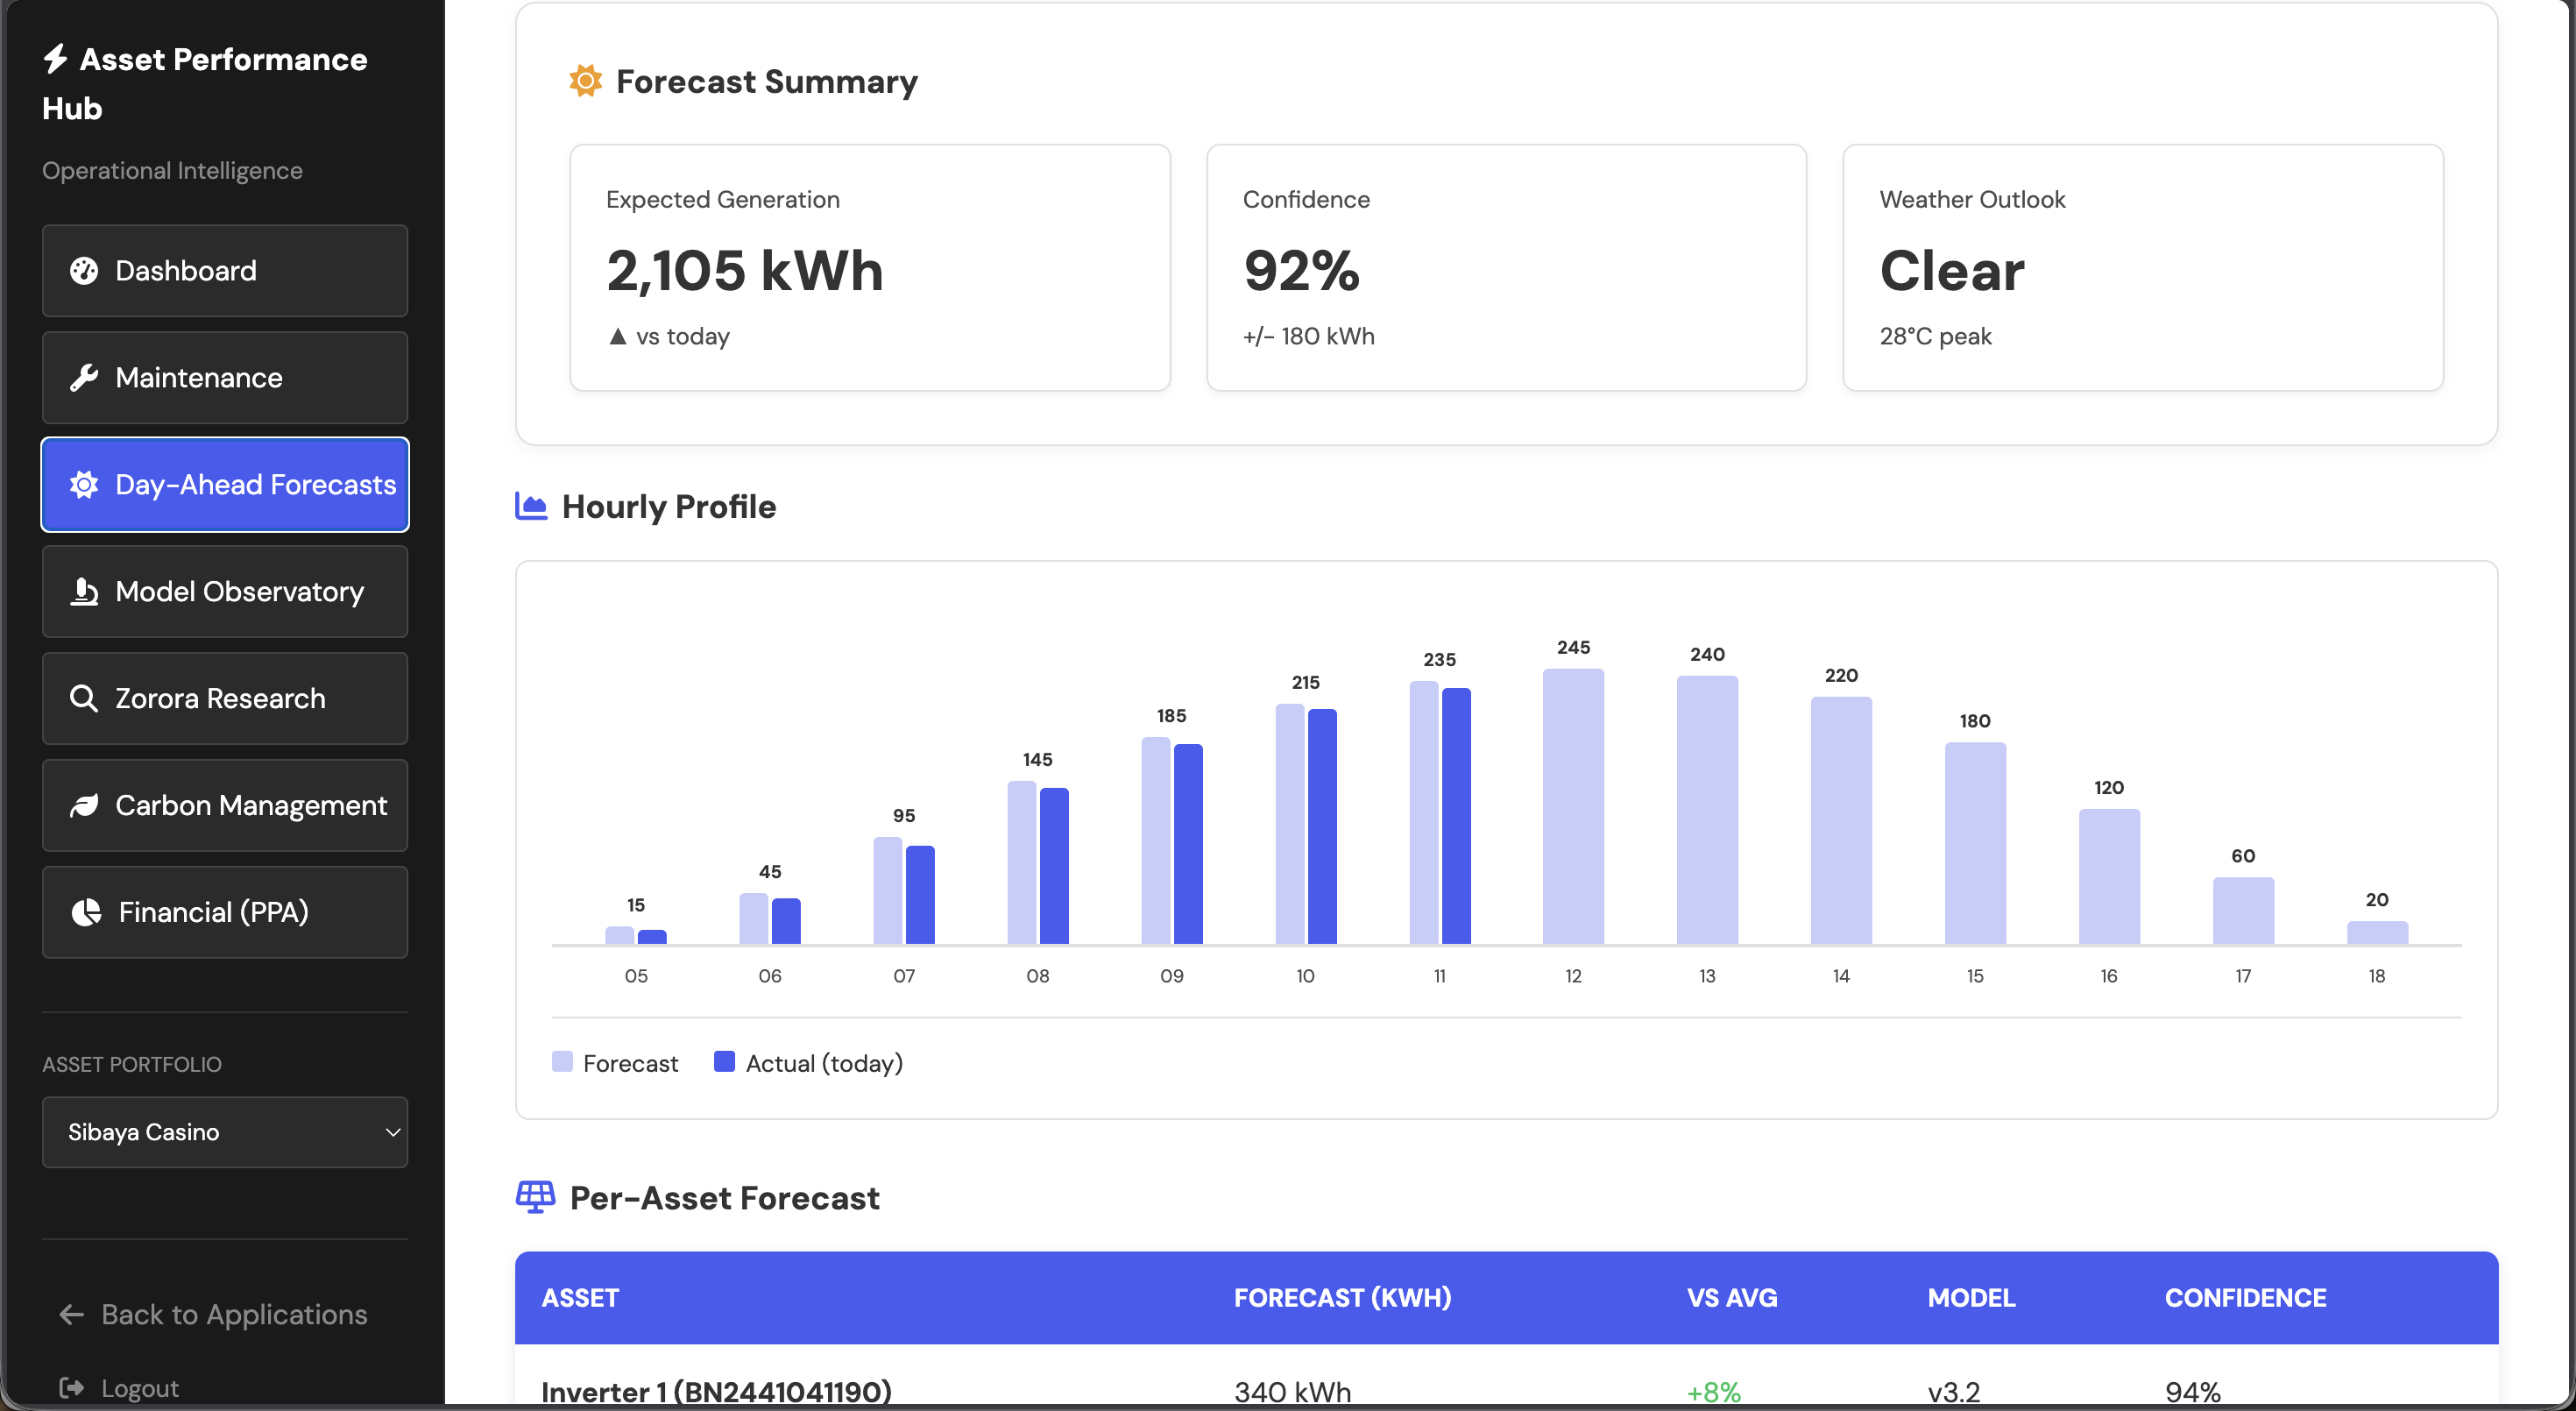
Site-tuned forecasts that adapt to your specific assets. Transfer learning delivers accurate predictions with as little as 3 months of historical data — no 2-year training window required.
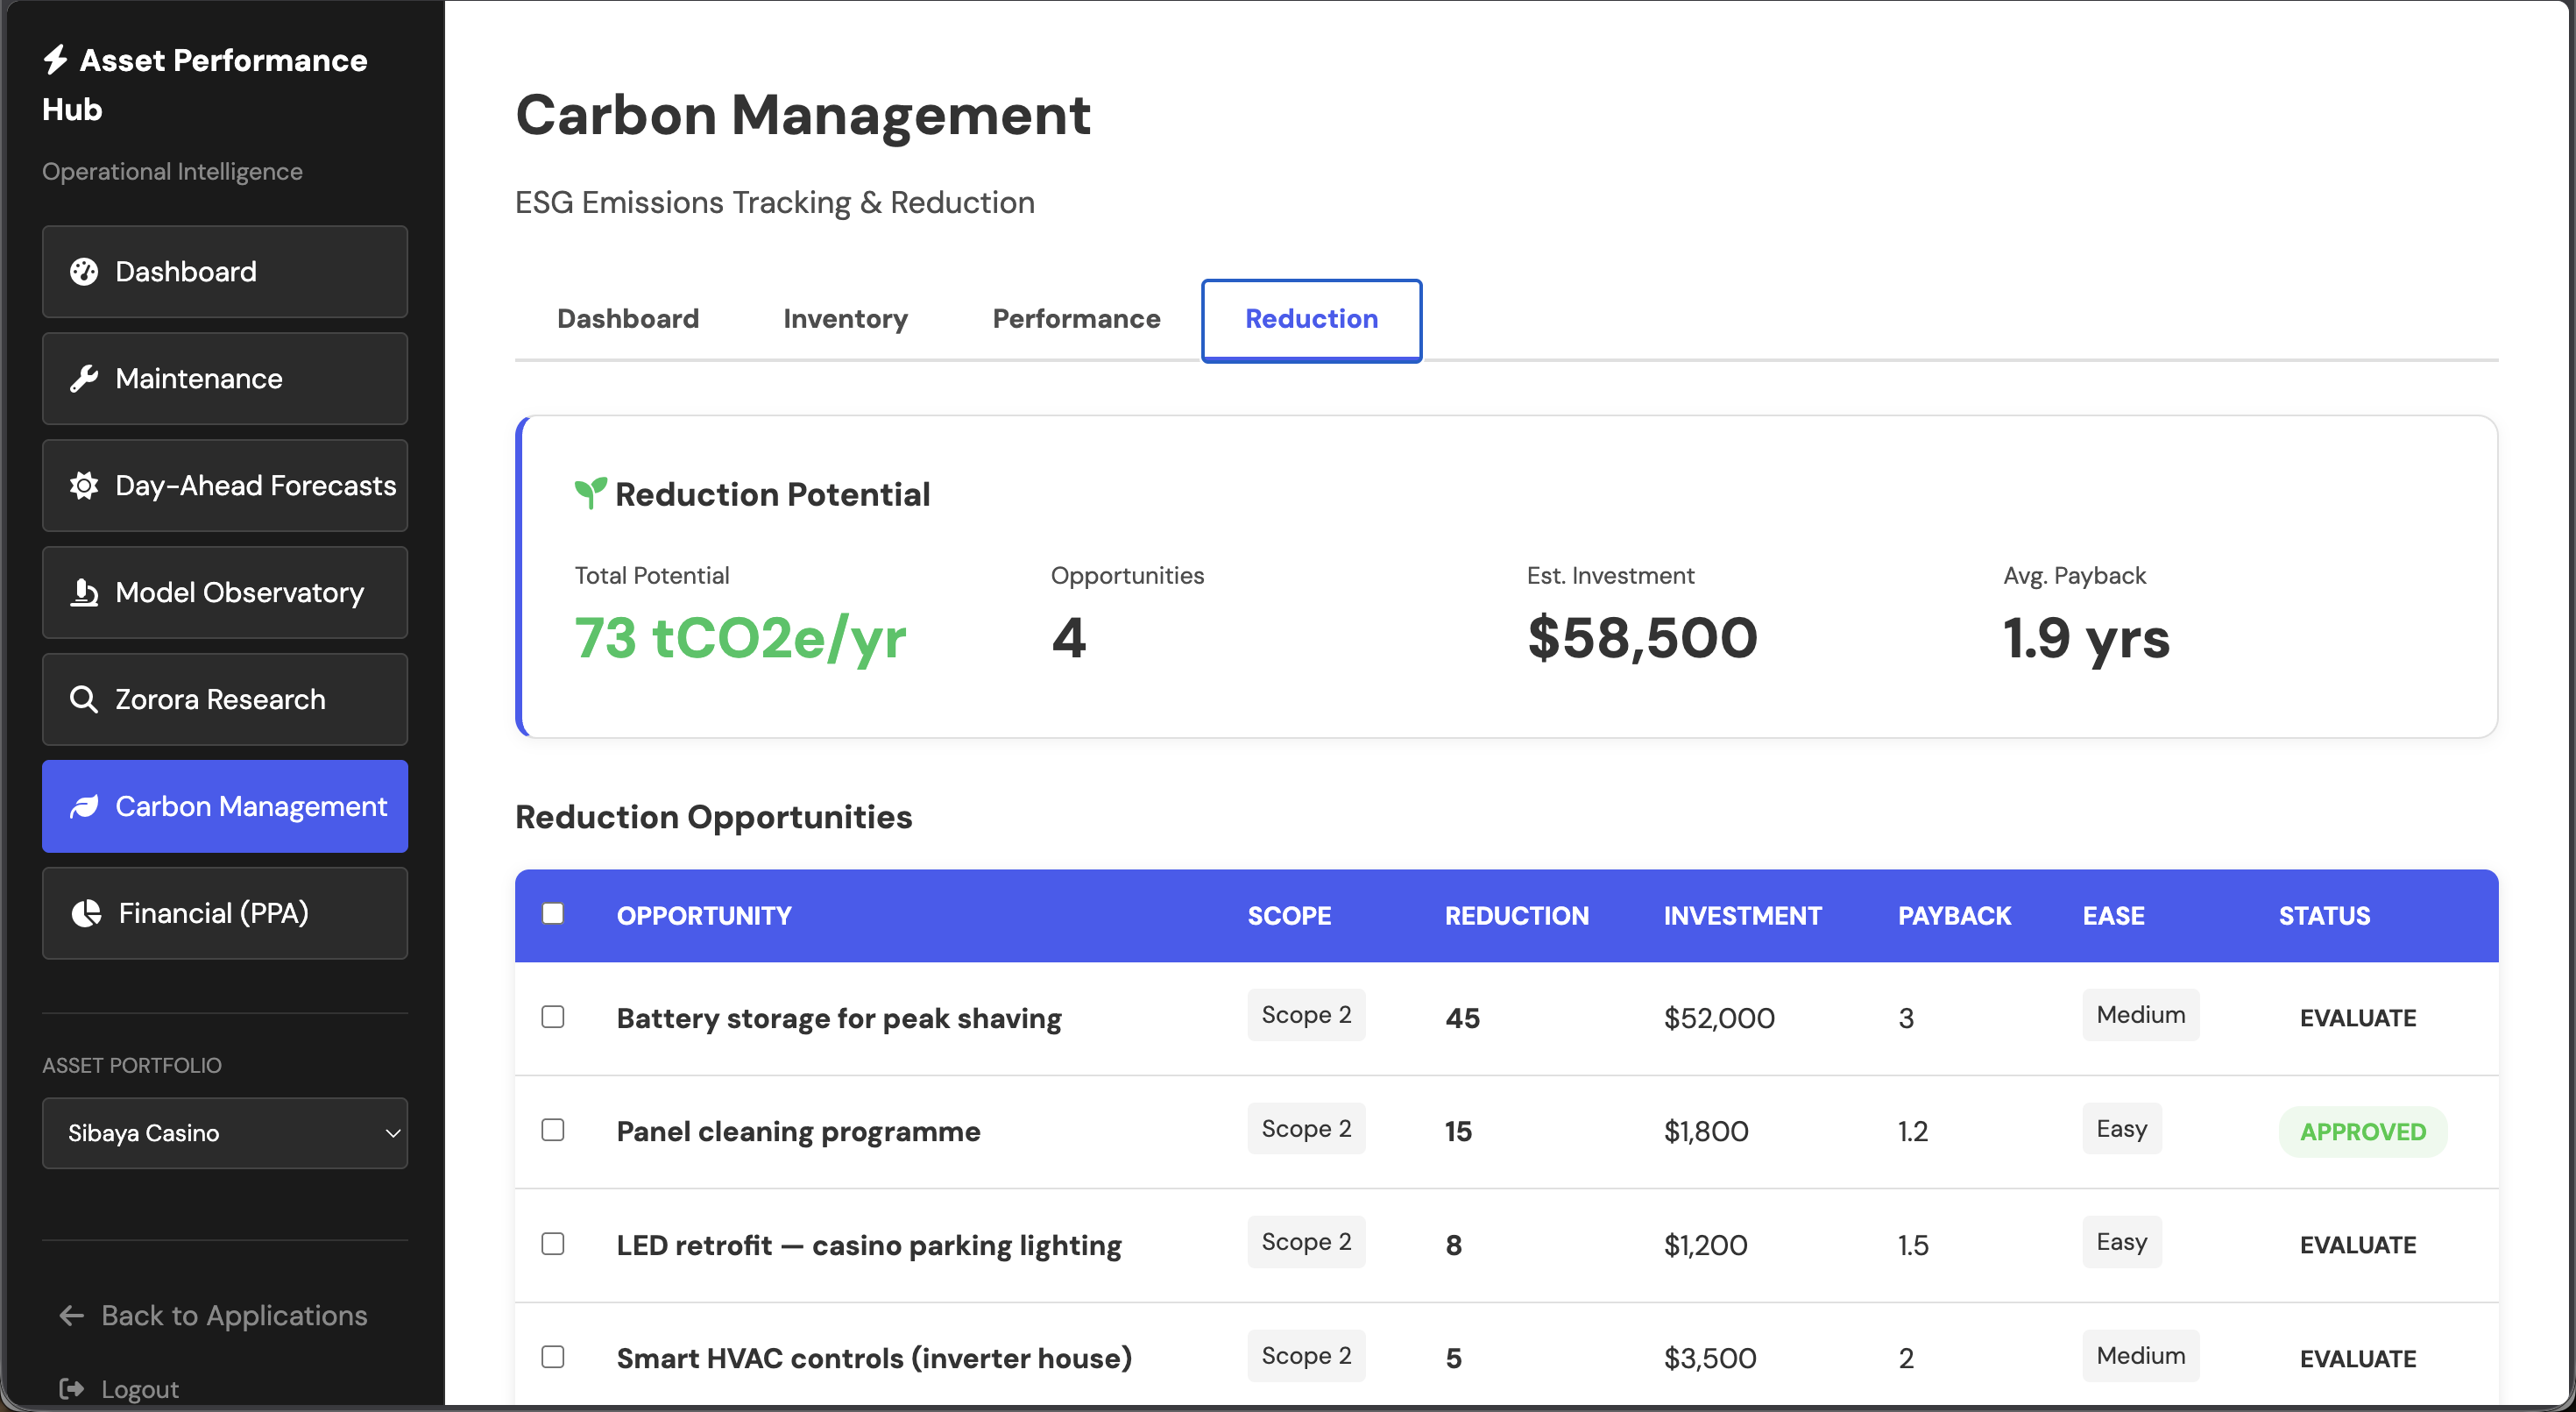
The same SCADA data feeds powering your forecasts and anomaly detection also drive your carbon footprint — no extra sensors, no additional integrations required.
API-based integration works with your existing SCADA systems, trading platforms, and reporting tools. No infrastructure changes required. Connect once, get unified intelligence across your entire portfolio.
See how eSUMS delivers measurable business value across forecasting, data resilience, anomaly detection, and edge deployment.
Achieving Forecasting Accuracy in 1 Week with Only 3 Months of Data
Only 3 months of historical data available for a 2.31 MW solar plant. Industry standard requires 24+ months for accurate forecasting models. Traditional site-specific training is impossible with limited local data.
Overcoming 65% Data Loss: Maintaining Operations Through Infrastructure Failure
Severe data loss—65% missing data points across multi-MW portfolio. Sensor and telemetry failures made traditional monitoring impossible. Most systems treat missing data as downtime for analytics.
Energy Asset Recovery: Identifying Revenue Opportunity Through Asset Optimization
System Performance Ratio at 74.1% vs 80% contractual target. 4 of 7 inverters underperforming with energy shortfall of 291,279 kWh (32.2%). Without per-inverter anomaly detection, cumulative losses go unnoticed.
Real-Time Intelligence: 2-5 Second Forecasts on ARM64 Edge Devices
Cloud lag costs money in trading. Need real-time decisions without cloud dependency. Connectivity loss shouldn't stop operations. Traditional cloud-based systems introduce latency and single points of failure.
From entry-level forecasting to full managed O&M — pick the tier that fits your operation.
| Tier | Price | API Calls | Overages | What You Get | |
|---|---|---|---|---|---|
| eSUMS Starter | $10/site/mo | 100,000/mo | $2.00/1k calls | Performance dashboard, anomaly detection (OODA) EAR daily reports • 7-day free trial |
Get Started |
| eSUMS Reports | $50/site/mo | 500,000/mo | $1.80/1k calls | Everything in Starter + pick one add-on: Forecasting, Carbon, or PPA • 14-day free trial |
Get Started |
| eSUMS Platform | $250/site/mo | 1,000,000/mo | $1.00/1k calls | All modules: forecasting, carbon, PPA, OODA Model observatory • Zorora add-on • 13-week pilot |
Get Started |
| Managed O&M | Custom | Unlimited | — | All modules + Zorora included Full O&M partnership via LTM • Dispatch & repairs Revenue share model • 13-week pilot |
Contact Sales |
All tiers run on the Open Data Schema for Energy (CC-BY-SA / Apache 2.0). Install the standard for free. When you're ready for intelligence, it scales up with zero integration cost.
Upload 3+ months of historical SCADA data (8760 CSV format). Get a 24-hour production forecast with hourly intervals—free, no signup required.
We don't just promise intelligence—we validate it across severe data challenges and complex environments.
Problem: Only 6 months of historical data for 1.5MW solar plant
Problem: Severe data loss—65% missing data points across portfolio
Problem: Coordinating Owner, O&M contractor, and Insurer across sites
eSUMS combines LTM's 15+ years of energy infrastructure expertise with cutting-edge predictive AI. We don't just deliver software—we deliver complete operational transformation backed by proven deployment capability.
Start with a technical assessment. We'll map your current fragmentation costs and show you exactly what unified intelligence delivers.
13-week validation pilot. If we don't hit 2 of 4 key metrics (Latency, MTTR, False Positives, Data Completeness), you get a full refund.