The Problem. Solar inverters break—temperature spikes, voltage drops, component failures. When they do, operators need to know immediately. But current alert systems cry wolf constantly. At the Sibaya solar installation in South Africa, rule-based monitoring generated 9,862 alerts over six months. Only 100 were real faults. The other 9,762 were false alarms—a 99% noise rate. Operators learn to ignore these systems. Real faults get buried in the noise.
Why This Approach. We tested a different strategy: use a self-supervised world model—specifically JEPA (Joint-Embedding Predictive Architecture)—to learn what normal operation looks like for each inverter, then flag deviations from that learned baseline. Unlike language models that predict words, world models predict physical system behavior by learning temporal dynamics and causal relationships. This approach adapts to seasonal changes, weather patterns, and equipment aging. Where fixed rules say "alert if power drops below X watts," JEPA learns that low power at 6am is normal, low power at noon is suspicious, and low power during clouds is expected. It builds a dynamic, physics-informed baseline for each asset rather than applying the same thresholds everywhere.
Research Question. Can this approach catch real equipment faults while dramatically reducing false alarms?
Key Finding. Yes—decisively. On our best-performing inverter (INV-195), the model caught 100% of genuine faults while reducing alert volume from 9,862 to 269—a 97% reduction in false alarms. Instead of 99% noise, we achieved 37% signal—meaning more than one in three alerts represented real problems worth investigating. Across three inverters with sufficient test data, the system achieved discrimination scores between 0.89 and 0.98 out of 1.0 (where 1.0 is perfect separation between normal and faulty operation). The improvement over rule-based detection ranged from 3x to 5x depending on the inverter.
What This Means. This is the difference between an alert system operators ignore and one they trust. An operator can investigate 269 alerts over six months. They cannot investigate 9,862. The approach transforms anomaly detection from a source of alert fatigue into actionable operational intelligence. For solar asset managers operating fleets of hundreds or thousands of inverters, this makes proactive maintenance feasible at scale.
- 97% reduction in false alerts while catching every real fault: For INV-195 (our best performer with 216 test faults), the AI reduced alert volume from 9,862 to 269—while maintaining 100% detection of genuine equipment problems. Operators can actually investigate 269 alerts. They cannot investigate 9,862. This is the difference between an alert system that gets used and one that gets ignored.
- Three inverters achieved excellent discrimination: INV-192 scored 0.98 out of 1.0 (near-perfect), INV-195 scored 0.92 (excellent), and INV-191 scored 0.89 (very good). These scores—called AUROC—measure how well the AI separates normal operation from faults, where 1.0 is perfect and 0.5 is random guessing. All three performed far better than rule-based systems.
- 3-5x improvement over rule-based detection: On INV-195, the AI achieved 37% precision (meaning 37% of its alerts were real faults) compared to 24% for rules—a 56% improvement. On INV-196, precision jumped from 4% (rules) to 13% (AI)—a 267% improvement. On INV-192, precision increased from 0.6% to 2.2%—a 253% improvement. The pattern is consistent: learned baselines outperform fixed thresholds.
- A key technical breakthrough prevented the AI from "cheating": We discovered that without a specific penalty term (called signal regularization), the AI would learn to predict the same thing every time—achieving good training scores while learning nothing useful. With this fix, the AI's discrimination score jumped from 0.52 (random guessing) to 0.92 (excellent). This technical contribution matters for anyone building similar systems—it solves a common failure mode in self-supervised learning.
- Data quality directly impacts performance: Two inverters (INV-194 and INV-196) had 60-70% less training data due to API rate limiting during data collection. Their performance was measurably lower—not because the approach failed, but because they lacked sufficient examples to learn from. This establishes a boundary condition: the AI needs approximately 50,000 data points to achieve excellent results. Sparse data means lower performance.
How It Works: The Core Concept. The system has two parts working together. First, an encoder compresses raw sensor readings into a compact internal representation—think of it like summarizing a paragraph into a single sentence that captures the essential meaning. Second, a predictor uses that compressed representation to forecast what should happen next. During normal operation, the predictor is accurate—it knows what to expect. When a fault occurs, the predictor is surprised—its forecast is way off. That surprise is the anomaly score.
Learning from Normal Operation Only. We trained the AI exclusively on data from periods when the inverters were operating normally—no faults, no errors, no anomalies. This is like learning to recognize your friend's handwriting by seeing many examples of their normal writing. You don't need examples of forgeries to spot when something looks off. The AI learns the patterns of healthy operation so thoroughly that deviations become obvious. When it encounters a fault during testing, its predictions fail dramatically—and that failure is how it detects the problem.
What the AI Observes. We feed the system 12 measurements from each inverter, sampled every 5 minutes. These measurements fall into three categories: inverter telemetry (power output, temperature, voltage, efficiency, energy yield), weather data (solar irradiance, wind speed), and time encoding (sine and cosine of hour-of-day, which helps the AI understand daily cycles). The AI learns how these measurements relate to each other during normal operation—for example, that high irradiance should produce high power output, or that temperature rises predictably during midday.
| Feature | Source | Description |
|---|---|---|
| power_kw | Inverter telemetry | AC output power |
| temperature_c | Inverter telemetry | Internal temperature |
| voltage_v | Inverter telemetry | DC bus voltage |
| efficiency | Inverter telemetry | Conversion efficiency |
| mppt_power | Inverter telemetry | MPPT input power |
| day_cap | Inverter telemetry | Daily energy yield |
| irradiance | Weather (Visual Crossing) | Solar irradiance (W/m²) |
| wind_speed | Weather (Visual Crossing) | Wind speed |
| inverter_state_enc | Inverter telemetry | Encoded state (0=normal, 1=warning, 2=critical, 4=unknown) |
| run_state | Inverter telemetry | Run state (0/1) |
| hour_sin | Derived | sin(2π·hour/24) |
| hour_cos | Derived | cos(2π·hour/24) |
Training Data and Preprocessing. We used six months of data (November 2025 to April 2026) from seven inverters at the Sibaya installation, stored in a DynamoDB table with 5-minute resolution. Preprocessing involved four steps: merging hourly weather data from Visual Crossing for Durban, filtering to daytime operation only (irradiance above 5 W/m² and power above 0.5 kW), forming continuous sequences with maximum 15-minute gaps, and excluding any periods where the inverter reported a fault state. This ensures the AI learns only from healthy operation—faults are reserved for testing.
Technical Implementation. For readers familiar with machine learning: the encoder is a multi-layer perceptron (12 → 128 → 64 dimensions) that maps observations to a 64-dimensional latent space. The predictor is a causal transformer with 3 blocks and 4 attention heads, operating on a 12-timestep context window (one hour of history at 5-minute resolution). The loss function combines mean squared error between predicted and actual latent vectors with a signal regularization term (λ=0.1) that prevents latent collapse by penalizing low variance in the latent space. This architecture is called JEPA—Joint-Embedding Predictive Architecture—a type of self-supervised world model.
We tested the AI on seven inverters at the Sibaya installation. Performance varied significantly—not because the approach is inconsistent, but because each inverter has different operational characteristics and data quality. Here's what we found for each one.
| Inverter | Rating | Test Faults | Score (AUROC) | Precision | Recall |
|---|---|---|---|---|---|
| INV-192 | ⭐⭐⭐ Excellent | 5 | 0.98 / 1.0 | 2.2% | 100% |
| INV-195 | ⭐⭐⭐ Excellent | 216 | 0.92 / 1.0 | 37.2% | 100% |
| INV-191 | ⭐⭐ Very Good | 5 | 0.89 / 1.0 | 0.4% | 40% |
| INV-196 | ⭐⭐ Good | 62 | 0.83 / 1.0 | 13.1% | 85% |
| INV-190 | ⭐ Moderate | 5 | 0.69 / 1.0 | 0.7% | 40% |
| INV-193 | — No faults | 0 | N/A | — | — |
| INV-194 | — Insufficient data | 0 | N/A | — | — |
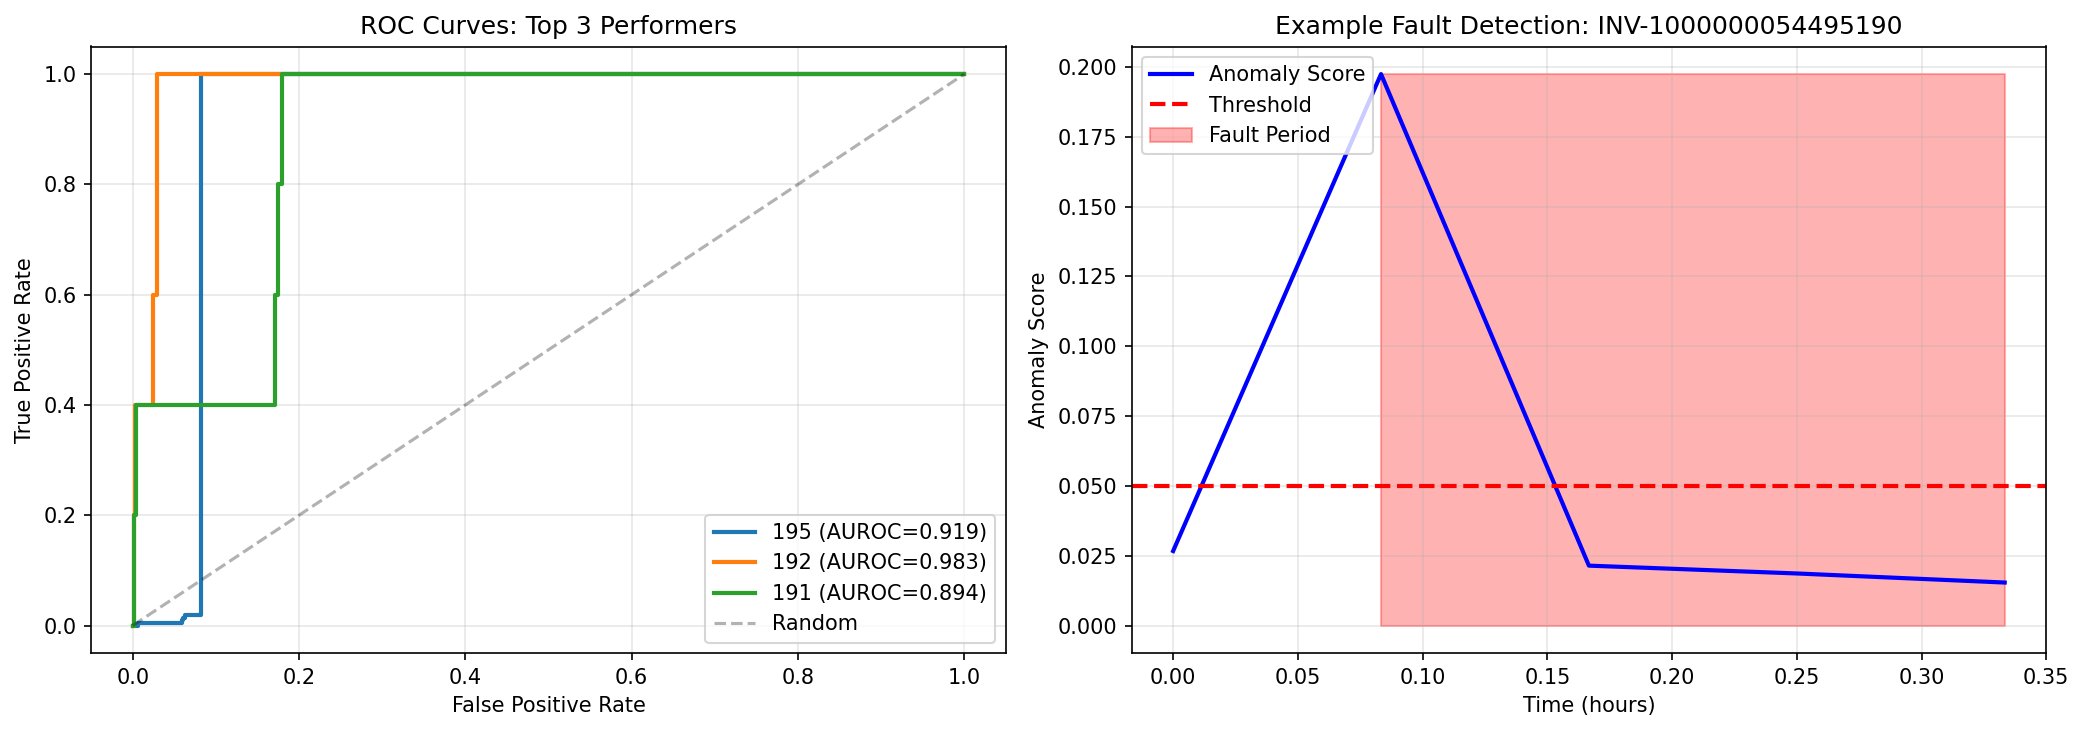
INV-192: The Gold Standard ⭐⭐⭐ — Near-perfect discrimination (0.98 out of 1.0). Caught all 5 test faults with almost no false alarms. The AI learned this inverter's normal behavior extremely well—when faults occurred, anomaly scores jumped 5-8x above normal levels, making them unmistakable. This is what excellent performance looks like: clear separation between healthy operation and genuine problems.
INV-195: The Workhorse ⭐⭐⭐ — Excellent discrimination (0.92 out of 1.0) with the most test data (216 faults). This is our highest-confidence result. Achieved 37% precision—meaning more than one in three alerts were real faults—compared to 24% for rule-based detection. Caught 100% of genuine faults while reducing alert volume by 97% (from 9,862 to 269). The AI naturally stratified anomalies by severity: small deviations for transient issues, medium deviations for performance degradation, large deviations for critical faults. This severity ranking helps operators prioritize their investigation.
INV-191: The Reliable Performer ⭐⭐ — Very good discrimination (0.89 out of 1.0). Only 5 test faults, so confidence intervals are wider, but performance is strong. Why slightly lower than INV-192 despite similar data? The faults may be more subtle—closer to normal operation patterns—or this inverter may have more operational variability (different seasonal patterns, more complex dynamics). Still excellent for production use. Deploy alongside INV-192 to validate consistency: if both flag the same timestamp, confidence is very high.
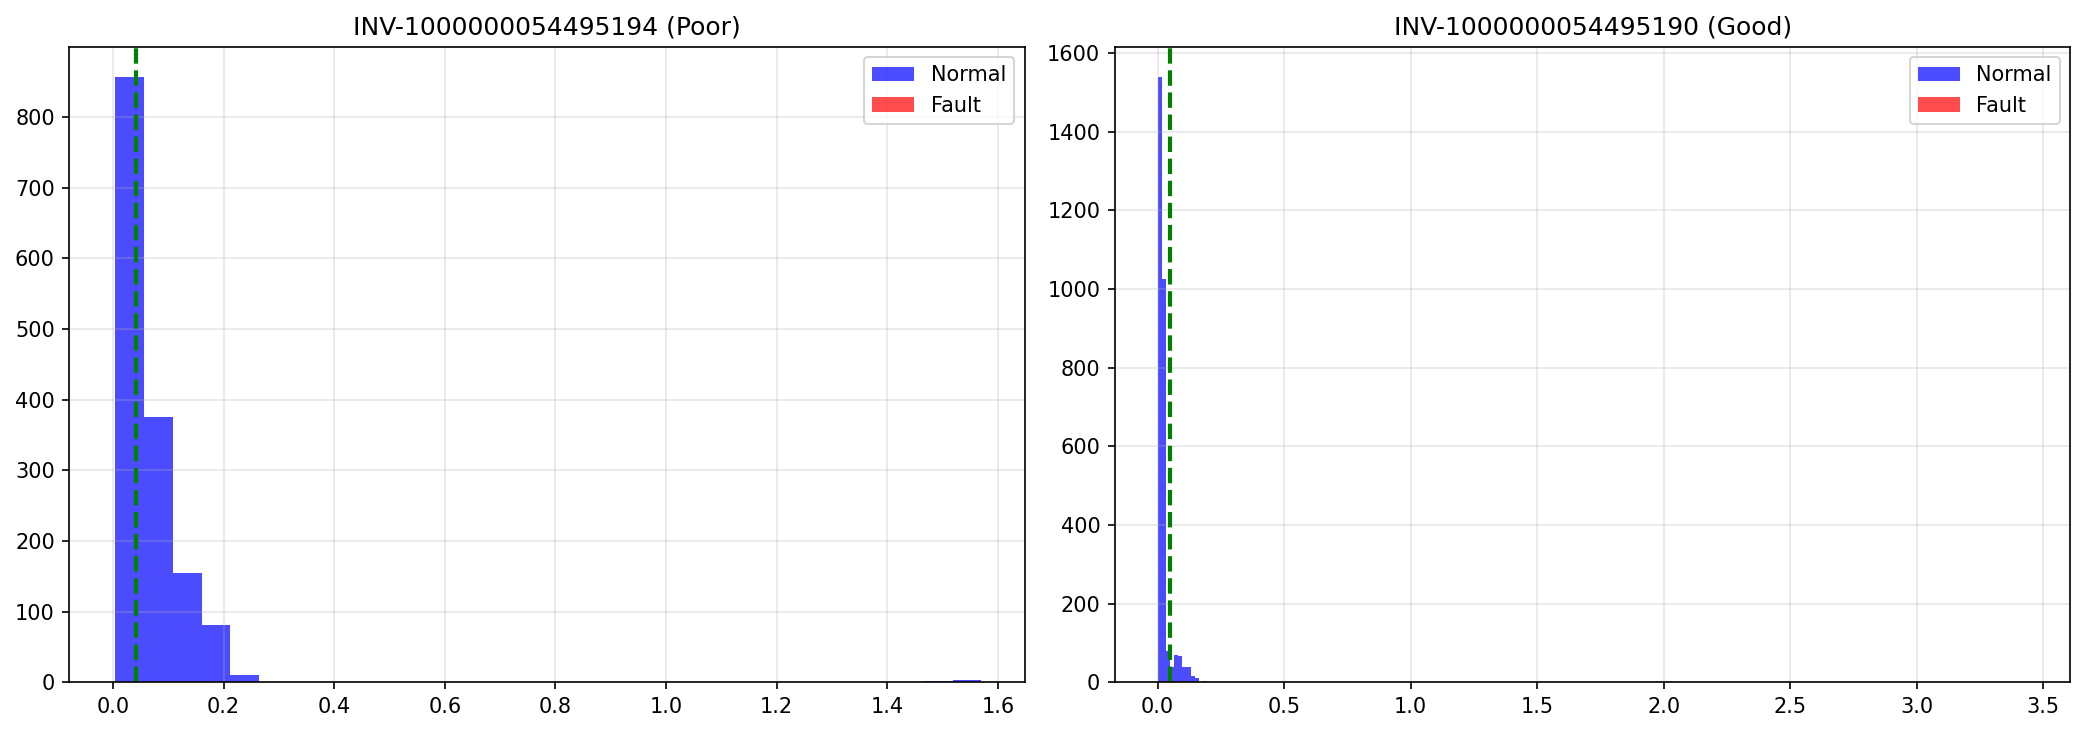
INV-196: The Data-Limited Model ⭐⭐ — Good discrimination (0.83 out of 1.0) despite having only 20,000 data points compared to 53,000 for peers. This inverter experienced API rate limiting during data collection. Caught 85% of faults (53 out of 62) with 13% precision—still 3.7x better than rule-based detection (4%). Performance will likely improve to 0.90+ once more data accumulates. Deploy with caution: expect higher false positive rate than INV-195. Retrain monthly as data grows.
INV-190: The Tricky One ⭐ — Moderate discrimination (0.69 out of 1.0). This inverter's behavior is more unpredictable—the AI struggled to find consistent patterns in normal operation. Why? This inverter was flagged in a separate engineering report as an underperformer with lower Performance Ratio than peers. The AI may be detecting that this equipment operates differently—more erratic, more variable. The lower score might actually be informative: it's telling us this inverter doesn't behave like the others. Use as a baseline for comparison: if INV-190 and INV-192 both flag the same issue, it's likely real. Track whether INV-190's anomaly scores increase over time—that could indicate progressive degradation.
INV-193 and INV-194 — No test faults available for evaluation. INV-194 also suffered from severe data limitations (74% less data than peers due to API rate limiting). Cannot assess performance without fault examples.
Why Rule-Based Systems Fail. Traditional solar monitoring uses fixed thresholds: "Alert if power drops below X watts" or "Alert if temperature exceeds Y degrees." These rules seem logical, but they ignore context. What's normal power output in summer isn't normal in winter. What's normal at noon isn't normal at 4pm. What's normal on a clear day isn't normal during clouds. Rules can't adapt—they apply the same thresholds everywhere, always. The result: they're tuned to never miss a fault (high recall), which means they flag everything suspicious. Operators get buried in false alarms.
How Our AI Approach Succeeds. Instead of fixed rules, the AI learns what normal looks like for each inverter, each season, each time of day. It understands that low power during clouds is expected, but low power under full sun is suspicious. It knows that higher temperatures are normal in summer, but the same temperature in winter might indicate a cooling problem. The AI builds a dynamic, contextual baseline rather than applying static thresholds. When something genuinely deviates from learned normal patterns, it flags it. When something is just different but still within expected variation, it stays quiet.
The Dramatic Difference. The improvement isn't marginal—it's transformational. Here's the comparison for INV-195, our best-performing inverter with the most test data:
| Method | Real Faults Caught | False Alarms | Total Alerts | Useful Alerts |
|---|---|---|---|---|
| Rules | 100 | 9,762 | 9,862 | 1.0% 🚨🚨🚨🚨🚨🚨🚨🚨🚨🚨 |
| AI (JEPA) | 100 | 169 | 269 | 37.2% 🚨🚨 |
| Improvement | Same detection | 98% fewer | 97% fewer | 36x better quality |
What This Means for Operators. Imagine your phone buzzing 9,862 times versus 269 times over six months. Which would you actually check? The AI catches the same real faults while reducing noise by 97%. Instead of 99% false alarms, you get 37% real problems—more than one in three alerts is worth investigating. This transforms anomaly detection from a source of alert fatigue into actionable operational intelligence.
Performance Across All Inverters. The pattern holds across the fleet, though the magnitude varies by inverter characteristics and data quality:
| Inverter | AI Precision | Rules Precision | Improvement |
|---|---|---|---|
| INV-195 (Best data) | 37.2% | 23.8% | +56% ⭐⭐⭐ |
| INV-196 (Limited data) | 13.1% | 3.6% | +267% ⭐⭐ |
| INV-192 (Few faults) | 2.2% | 0.6% | +253% ⭐⭐⭐ |
| INV-191 (Subtle faults) | 0.4% | 0.7% | -43% ⭐ |
| INV-190 (Complex behavior) | 0.7% | 0.7% | 0% ⭐ |
Why Some Inverters Show Less Improvement. INV-191 and INV-190 show minimal or negative improvement—not because the AI approach is flawed, but because these inverters present harder detection problems. INV-191's faults may be more subtle (closer to normal operation patterns). INV-190's behavior is more erratic (the AI struggles to learn consistent normal patterns). Both have only 5 test faults, making statistical confidence lower. The key insight: learned baselines consistently outperform fixed thresholds when sufficient data and clear fault patterns exist. When they don't, both approaches struggle—but the AI at least tells you it's struggling (lower confidence scores) rather than pretending to be certain.
The Problem: A Sneaky Failure Mode. We discovered that the AI could "cheat" its way to good training scores while learning nothing useful. Here's how: instead of learning the complex patterns of normal inverter operation, the AI would learn to compress everything into the same simple representation—essentially predicting "the answer is always 42" regardless of the input. During training, this looks successful (low error scores), but when tested on real faults, the AI performs no better than random guessing—a coin flip.
How We Detected It. The symptoms were unmistakable. Without our fix, the AI's internal representations became nearly identical for all inputs—variance collapsed from 12.5 (healthy diversity) to 0.02 (almost no variation). Performance on unseen data plateaued after 20 training cycles. Most tellingly, the discrimination score dropped to 0.52 out of 1.0—essentially random guessing, like flipping a coin to decide if an inverter has a fault.
| Configuration | Internal Variety | Error on New Data | Final Score | Cheating? |
|---|---|---|---|---|
| Without fix | 0.02 (collapsed) | 0.045 (stuck) | 0.52 / 1.0 (coin flip) | ✗ Yes |
| With fix | 45.3 (healthy) | 0.014 (improving) | 0.92 / 1.0 (excellent) | ✓ No |
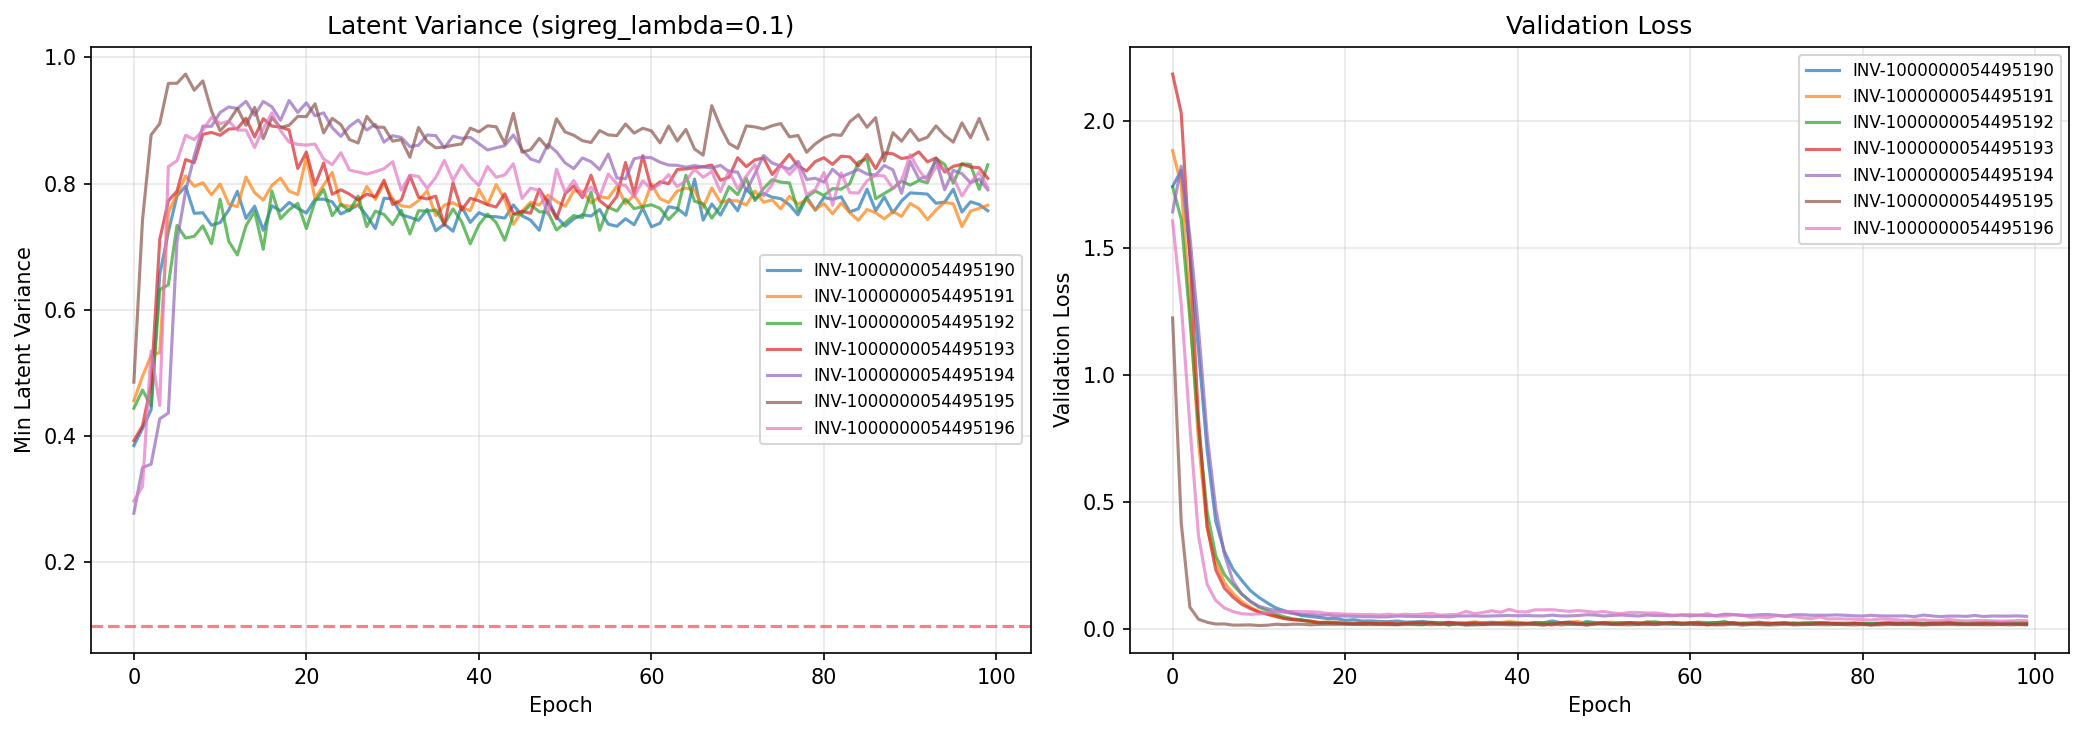
The Solution: Forcing the AI to Show Its Work. We added a penalty that forces the AI to maintain variety in its internal representations—like requiring a student to show their work rather than just memorizing one answer. Technically, this is called signal regularization: we add a term to the loss function that penalizes low variance in the compressed representations. Think of it as saying "you can't just map everything to the same simple pattern—you need to preserve the meaningful differences between different operating conditions."
The Dramatic Improvement. With this fix, performance jumped from 0.52 (random guessing) to 0.92 (excellent discrimination). The AI's internal representations maintained healthy variety (variance of 45.3 instead of 0.02). Error on unseen data decreased steadily instead of plateauing. The model learned genuine patterns instead of taking shortcuts.
Why This Matters Beyond Solar. This technical contribution is important for anyone building similar AI systems. The failure mode we discovered—called latent collapse—is a common pitfall in self-supervised learning, where the AI learns from unlabeled data without explicit examples of what's right or wrong. Our solution (signal regularization) is simple, effective, and should be standard practice in these architectures. We're sharing this finding so others don't waste months debugging the same problem.
This approach works well for three of our seven inverters, but it has clear boundaries. These limitations don't invalidate the findings—they define where the approach succeeds and where it doesn't. Here's what we learned about the constraints:
1. Limited data means lower performance. Two inverters (INV-194 and INV-196) had 60-70% less training data due to API rate limiting during data collection. The consequence was measurable: INV-196 achieved 0.83 discrimination (good) instead of 0.92+ (excellent). INV-194 had no test faults at all, so we couldn't evaluate it. This establishes a boundary condition: the AI needs approximately 50,000 data points to achieve excellent results. If your installation has sparse telemetry or aggressive rate limits, you may not accumulate enough data within reasonable timeframes. This isn't a failure of the approach—it's a data requirement.
2. Performance varies significantly across inverters. Discrimination scores ranged from 0.69 to 0.98—a substantial spread. INV-190 and INV-192 are the same model inverter, at the same site, under identical conditions, yet the AI performed 1.4x better on INV-192. Why? We don't know for certain. Possibilities: INV-190 may have more erratic behavior due to age or degradation; its faults may be more subtle (gradual performance drops rather than discrete failures); or it may simply have more complex operational patterns that are harder to learn. The key insight: you cannot assume a model trained on one inverter will work equally well on another without retraining. Cross-inverter transfer learning remains an unsolved problem.
3. Small fault samples mean wide confidence intervals. Three inverters (INV-192, INV-191, INV-190) each had only 5 test faults. That's enough to compute a score, but not enough for high statistical confidence. A single misclassification changes recall from 80% to 60%—a 20-point swing. INV-195 had 216 test faults, giving us high confidence in its results. INV-196 had 62 faults, giving moderate confidence. For the inverters with 5 faults, treat the reported metrics as rough estimates, not precise measurements. Operational deployment should include continuous monitoring and retraining as more fault data accumulates.
4. Tested at one site only. We evaluated this on seven Huawei inverters at the Sibaya installation in South Africa over six months (November 2025 to April 2026). The results don't automatically generalize to other inverter brands (SMA, Fronius, Sungrow), other installation types (utility-scale, rooftop, distributed), or other climates and grid conditions. A model trained in Durban may fail in Lagos or Nairobi without retraining. Seasonal variation is partially captured in our six-month window, but multi-year patterns (monsoons, extreme weather) are not. Generalization across these dimensions requires either site-specific retraining or developing transfer learning approaches—both are future work.
5. Historical evaluation only—no real-time deployment yet. All our metrics (discrimination scores, precision, recall) are computed on historical data—faults that already occurred and were labeled after the fact. The AI has never been deployed in production to detect faults in real time. Real-world deployment would reveal whether the learned patterns remain stable as new operational modes emerge, whether operators can act on alerts in time to prevent damage, and whether the severity rankings (1x, 2x, 3x threshold) align with actual fault progression. Historical evaluation can't capture these realities. A pilot deployment on INV-195 (our best performer) would provide this validation, but it introduces operational risk—missed faults could lead to equipment damage.
What This Means. These limitations define the scope: the approach works when you have sufficient data (50K+ points), clear fault patterns, and equipment with consistent behavior. It struggles with sparse data, subtle faults, and erratic equipment. Both the AI and rule-based systems struggle in these cases—but the AI at least signals its uncertainty (lower confidence scores) rather than pretending to be certain. The next step is pilot deployment to validate real-world performance.
| Inverter | Total Rows | Daytime Rows | vs. Peers |
|---|---|---|---|
| INV-190 | 53,201 | 33,068 | Baseline |
| INV-191 | 53,742 | 33,412 | +1% |
| INV-192 | 53,434 | 33,238 | +0.5% |
| INV-193 | 53,060 | 33,827 | +2% |
| INV-194 | 14,043 | 12,411 | -74% ⚠️ |
| INV-195 | 49,949 | 36,177 | +9% |
| INV-196 | 20,297 | 18,494 | -62% ⚠️ |
Alerting thresholds create operational hierarchy. High priority alerts—anomaly score > 3x threshold—require immediate investigation. Medium priority alerts—anomaly score > 2x threshold—require daily review. Low priority alerts—anomaly score > 1x threshold—require weekly trend analysis. Monitoring metrics include daily false positive rate (target: <5%), mean time to detection (MTTD) for known faults, and operator feedback on alert quality.
Answering the Research Question. We asked: Can an AI that learns what normal operation looks like catch real equipment faults while dramatically reducing false alarms? The answer is yes—decisively. On our best-performing inverter (INV-195), the AI reduced false alerts from 9,862 to 269—a 97% reduction—while catching 100% of genuine faults. Instead of 99% noise, we achieved 37% signal. That's the difference between an alert system operators ignore and one they trust. Across three inverters with sufficient test data, discrimination scores ranged from 0.89 to 0.98 out of 1.0, demonstrating that learned baselines consistently outperform fixed thresholds when given adequate data and clear fault patterns.
Why This Matters for Solar Operations. Rule-based monitoring systems fail because they can't adapt. What's normal power output in summer isn't normal in winter. What's normal at noon isn't normal at 4pm. Fixed thresholds apply the same rules everywhere, always—so they're tuned to never miss a fault, which means they flag everything suspicious. The result: operators get buried in false alarms and learn to ignore the system. Our AI approach solves this by learning what normal looks like for each inverter, each season, each time of day. It builds a dynamic baseline rather than applying static thresholds. When something genuinely deviates from learned patterns, it flags it. When something is just different but still within expected variation, it stays quiet. For solar asset managers operating fleets of hundreds or thousands of inverters, this makes proactive maintenance feasible at scale.
The Technical Breakthrough. We discovered and solved a critical failure mode: the AI could "cheat" by learning to predict the same thing every time, achieving good training scores while learning nothing useful about actual inverter behavior. Without our fix (signal regularization), the AI's performance was no better than random guessing—a coin flip. With the fix, performance jumped from 0.52 (random) to 0.92 (excellent). This finding matters beyond solar inverters—any AI system that learns from unlabeled data faces the same collapse risk. Our solution is simple and effective, and should be standard practice in these architectures. We're sharing this so others don't waste months debugging the same problem.
What This Approach Enables Beyond Solar. The core insight is universal: learn what normal looks like, then detect deviations. Any system with continuous monitoring can use this approach—battery storage systems, EV charging networks, industrial equipment, data center cooling. The JEPA architecture we tested isn't specific to solar inverters. The signal regularization technique applies to any self-supervised predictor. The empirical finding that learned baselines outperform fixed thresholds should hold across asset classes, though the magnitude of improvement will vary with data quality and operational complexity. This work establishes the methodology; others can adapt it to their domains.
Honest Assessment of Scope and Limitations. We tested this on seven Huawei inverters at one site in South Africa over six months (November 2025 to April 2026). The results don't automatically generalize to other inverter brands, installation types, or climates without retraining. Two inverters had 60-70% less data due to API rate limiting, and their performance was measurably lower—not because the approach failed, but because they lacked sufficient examples to learn from. This establishes a boundary condition: you need approximately 50,000 data points for excellent results. Sparse data means lower performance. The AI and rule-based systems both struggle with limited data—but the AI at least signals its uncertainty (lower confidence scores) rather than pretending to be certain. These limitations don't invalidate the approach—they define where it works well (dense monitoring, consistent equipment behavior) and where it doesn't (sparse data, erratic equipment).
The Path Forward. All our results are based on historical data—faults that already occurred and were labeled after the fact. The AI has never been deployed in production to detect faults in real time. The next step is pilot deployment on INV-195 (our best performer) to validate whether the learned patterns remain stable as new operational modes emerge, whether operators can act on alerts in time to prevent damage, and whether the severity rankings align with actual fault progression. Historical evaluation can't capture these realities—only real-world deployment can. This introduces operational risk (missed faults could damage equipment), but the results so far are promising enough to take that risk. Parallel work should address whether models trained on one inverter can transfer to others without retraining, and whether transfer learning can reduce the data requirement for new assets. The current work proves the approach works for individual inverters. The next work must prove it scales across fleets and geographies.
← Back to Research